Or try one of the following: 詹姆斯.com, adult swim, Afterdawn, Ajaxian, Andy Budd, Ask a Ninja, AtomEnabled.org, BBC News, BBC Arabic, BBC China, BBC Russia, Brent Simmons, Channel Frederator, CNN, Digg, Diggnation, Flickr, Google News, Google Video, Harvard Law, Hebrew Language, InfoWorld, iTunes, Japanese Language, Korean Language, mir.aculo.us, Movie Trailers, Newspond, Nick Bradbury, OK/Cancel, OS News, Phil Ringnalda, Photoshop Videocast, reddit, Romanian Language, Russian Language, Ryan Parman, Traditional Chinese Language, Technorati, Tim Bray, TUAW, TVgasm, UNEASYsilence, Web 2.0 Show, Windows Vista Blog, XKCD, Yahoo! News, You Tube, Zeldman
Building AI apps and agents with Microsoft Foundry | InfoWorld
Technology insight for the enterpriseNo, AI won’t destroy software development jobs 6 May 2026, 2:00 am
I’m not even remotely worried about AI eliminating software development jobs. In fact, I’m pretty sure there will soon be a boom in both software development jobs and the amount of software available to everyone.
People have always worried about automation causing massive unemployment. Each time a breakthrough happens, folks are sure that “it will be different this time.” Only it never is different.
But the worriers persist.
It’s paradoxical
You can tell them all about the Jevons paradox — the observation that as something becomes more efficient, demand for that more efficient thing increases rather than decreases. In the mid-19th century, William Jevons noticed that the use of coal became more efficient. Humans figured out how to get more heat and energy out of less and less coal. The common belief was that, because less coal was needed for the same amount of energy or heat, there would be less demand for coal as a result. Everyone was concerned that coal miners would lose their jobs. But Jevons noticed that demand for coal actually went up, as the more efficient processes led to more widespread uses for coal.
The same thing happened half a century earlier with the introduction of the automated loom. Despite fears that the power loom would destroy jobs for weavers, it made the production of clothing and other textile products cheaper, increasing demand for such products and increased employment in the textile industry.
This phenomenon can be seen over and over again. Spinning jennies, automobiles, computers, robotic manufacturing, tractors, sewing machines, and countless other inventions all caused widespread fears of job loss, but the fears were never really realized. When a company can suddenly produce 10 times more with the people they have, they have always wanted to produce 10 times more, not cut their workforce by 90%. Yet here we are, with everyone sure that AI is going to put us all out of work.
It’s not going to happen — especially in the software development realm. You know what is going to happen? The same thing that always happens. That which is automated and made more efficient will find new and different ways to express itself. Existing software will suddenly be vastly more useful as the backlog of features can be implemented. New software ideas that were previously too complex for humans to write and manage will be created.
Marc Andreessen was never so right as when he said that “software is eating the world.” Sure, software was eating a lot when humans wrote every line of code. But now that code can be written 10 or 100 times faster, software’s appetite will go from hungry to ravenous. The work that can be done has expanded rapidly. And that work will be done because there is too much money in building what we have always wanted but that humans alone could not deliver.
A positive-sum game
The world is never a zero-sum game, but humans seem hard-wired to view the world that way. Only now, with AI, we have what Daniel Jefferies delightfully calls “Fear Mongering as a Service,” running rife through our industry. Yet while all the Chicken Littles decry the job market falling out of the sky, job postings continue to actually increase, and it is becoming harder to fill those jobs.
Now that doesn’t mean the market isn’t shifting. The demand is strong for experienced engineers and weaker for entry-level jobs, a situation that is creating a bit of a paradox all by itself. The skills that worked for many years may not be as valuable going forward. Writing good code and getting an AI agent to write good code are two different but related skills.
Now, I recognize that the debate on this matter is strong and that there are many folks who will take the opposing side. Some will argue that software development shops overhired during Covid and that the resulting adjustments are going to put a damper on things. Some argue that the increase in job postings is merely a scam, with AI generating many of the new postings, and that the increase in job openings is a fraud. Could be. But it doesn’t matter.
So go ahead and panic if you want — update your résumé, run around flapping your arms, and cry that the sky is falling. Me? I’ve seen the PC “destroy” mainframe jobs, the internet “destroy” off-the-shelf software, open source “destroy” commercial software, and offshoring “destroy” the American programming market. Things are going pretty well considering all this “destruction.” I can’t wait for AI to “destroy” our current developer market.
Designing front-end systems for cloud failure 6 May 2026, 2:00 am
Modern frontend applications rely on cloud services for far more than basic data fetching. Authentication, search, file uploads, feature flags, notifications and analytics often depend on APIs and managed services running behind the scenes. Because of that, frontend reliability is closely tied to cloud reliability, even when the frontend team does not directly own the infrastructure.
This is often one of the biggest mindsets shifts for frontend engineers. We often think about failure as a total outage where the whole site is down. In practice, that is not what most users experience. More often, the interface is partially degraded: A dashboard loads but one panel is empty, a form saves but the confirmation never arrives, or a file upload stalls while the rest of the page still appears normal.
That is why I think frontend resilience deserves more attention in day-to-day engineering conversations. The goal is not to prevent every cloud issue. That is rarely realistic. The more practical goal is to build interfaces that stay usable, calm and understandable when cloud services or other dependencies hiccup. Reliability guidance from major cloud platforms is useful here because it frames reliability as the ability of a workload to perform correctly and recover from failure over time, not just remain available in ideal conditions. Those reliability design principles offer a broader cloud perspective that can inform frontend decisions.
Why cloud failures matter to frontend engineers
Cloud platforms are designed for scale and availability, but they still depend on many moving parts. Requests can fail because of temporary network instability, slow downstream services, expired credentials, rate limiting or short-lived infrastructure problems. Sometimes the issue is not in the primary API at all. It can be in storage, identity, messaging or another supporting service that the user never sees directly.
From a frontend perspective, the important lesson is that failures are often partial, not absolute. A product list may load correctly while recommendations fail. Login may work while user preferences do not. Search may return results, but analytics events may silently drop. When teams assume every dependency either succeeds together or fails together, they tend to create brittle interfaces that turn one bad response into a blank screen.
Resilient frontend systems often start with a simpler question: What is the minimum useful version of this screen if one dependency is unavailable? That question changes how you design loading states, component boundaries and recovery behavior. It also encourages a more honest relationship between frontend and backend teams, because the frontend is designed for real operating conditions instead of perfect demos.
Designing for graceful degradation in real products
One practical reliability habit in frontend systems is separating critical features from non-critical ones. Critical features are the parts users need to complete their main task. Non-critical features add richness, context or convenience, but the product can still provide value without them for a short period. On an account page, profile details and security settings may be critical. A recent activity panel or personalized recommendations may be useful, but not essential in the moment.
That distinction helps teams decide where to invest in stronger fallback behavior. If a non-critical feature fails, the interface can hide the section, show cached data or swap in a simpler default state. If a critical feature fails, the user needs a much clearer recovery path. That might mean preserving unsaved input, offering a visible retry action or falling back to a server-confirmed state instead of leaving the UI in limbo.
Retries are part of that picture, but they need to be used carefully. Common cloud reliability guidance emphasizes controlled retries, exponential backoff and jitter rather than aggressive repeated requests. That matches what I have seen from the frontend side as well. Retrying a read request after a short delay can smooth out transient failures. Retrying a write action without safeguards can create duplicate submissions, conflicting state or user confusion. A frontend should treat retries as a deliberate recovery tool, not a reflex.
The user experience matters just as much as the retry policy. If the application is attempting recovery in the background, the interface should say so. Endless spinners are rarely reassuring. Clear language such as “Still trying to load your recent activity” or “We’re retrying your request” makes the system feel more transparent. It also gives users a reason to wait instead of assuming the product is frozen.
This is also where partial rendering becomes powerful. Interfaces are often more resilient when they isolate failures instead of spreading them. If one widget fails, the rest of the dashboard should still render. If one secondary API is unavailable, the page should still load primary content. A resilient frontend should not require every backend dependency to succeed perfectly before it shows something useful. That design choice often matters more than any individual recovery tactic.
What resilient failure states look like in practice
Good failure handling is not only technical. It is also a communication problem. When users encounter an issue, they need to know what failed, what still works and what they can do next. Generic messages like “Something went wrong” usually fail on all three counts. They are vague, they do not reduce anxiety and they do not support recovery.
A better message is specific without becoming overly technical. For example: “We couldn’t load your recent activity right now. Your account details are still available. Please try again in a few minutes.” That kind of message reassures the user that the whole product is not broken and gives them a practical next step. It also reflects a more mature product mindset: Failures should be contained, explained and recoverable.
One area where this matters a lot is form-heavy workflows. Frontend systems can lose user trust quickly when a submission fails and the user loses everything they typed. Preserving user input should be a baseline expectation for critical flows. Even basic browser capabilities and web APIs can support better failure handling here. For example, the Fetch API and AbortController give frontend teams a cleaner way to manage request lifecycles, cancel stale requests and avoid leaving the interface stuck in outdated loading states. These are small implementation details, but they often shape whether the product feels reliable under stress.
The same principle applies to fallback data. In some cases, showing cached or last-known information is more helpful than showing nothing at all. In others, it is better to hide a non-essential section until the dependency recovers. There is no single universal pattern. What matters is choosing a failure state that matches user intent. If the user is trying to complete a task, support task completion. If the user needs context, preserve as much trustworthy context as possible.
Cloud failures will continue to happen, even in mature environments. For frontend engineers, resilience is less about dramatic disaster handling and more about small design decisions made early: Isolating failures, protecting user work, controlling retries, rendering partial content and writing clearer recovery messages. When those decisions are made well, users may never know what failed behind the scenes. They only notice that the application remained usable, understandable and calm under pressure.
This article is published as part of the Foundry Expert Contributor Network.
Want to join?
Building AI apps and agents with Microsoft Foundry 6 May 2026, 2:00 am
At first glance, Microsoft Foundry looks like a big grab bag of every AI-adjacent service that Microsoft has offered in the last decade, plus some new ones. In Microsoft’s own words, “Foundry consolidates several previous Azure AI services and tools into a unified platform” and “unifies agents, models, and tools under a single management grouping.”
Microsoft Foundry helps application developers to build and deploy agents, which may use models and tools. It also helps machine learning (ML) engineers and data scientists to fine-tune models, run evaluations, and manage model deployments. Finally, it helps IT administrators and platform engineers to govern AI resources, enforce policies, and manage access across teams. It isn’t quite a floor wax and a dessert topping, but it does try to serve three distinct audiences.
Key capabilities of Microsoft Foundry for building agents include multi-agent orchestration, workflows, a tool catalog, memory, knowledge integration, and publishing. Key capabilities for operation and governance include real-time observability, centralized AI asset management, and enterprise controls.
Microsoft Foundry competes directly with the Google Cloud Agent Development Kit (ADK), Amazon Bedrock AgentCore, and Databricks Agent Bricks. Additional competitors include the OpenAI Agents SDK, LangChain/LangGraph, CrewAI, and SmythOS.
Microsoft Foundry Agent Service
The Microsoft Foundry Agent Service is a helpful platform that guides you through the development, deployment, and scaling of AI agents. These agents use large language models (LLMs) to handle tricky requests, connect with other tools, and do tasks on their own.
The service groups agents into three main types: prompt agents, which are easy to set up and great for quickly trying out ideas; workflow agents, which are visual or YAML-based tools that make automating several steps easier; and hosted agents, which are containers that let you manage your own code as well as frameworks like LangGraph.
Microsoft Foundry also has a model catalog with both new and well-known models, and a tool catalog that includes web search, memory management, and code execution.
The platform uses guardrails and controls to keep things secure, like stopping prompt injection. Plus, it supports private networks, versioning, managing the infrastructure, and full monitoring.
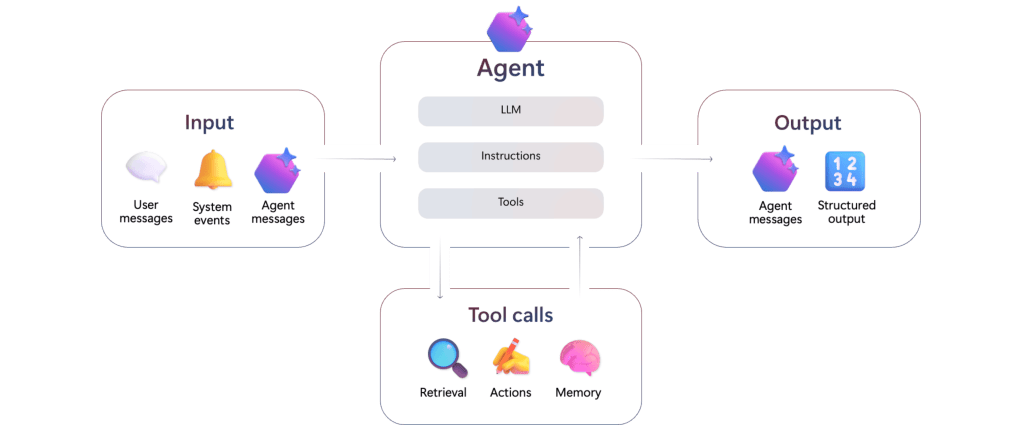
The Microsoft Foundry Agent Service accepts inputs from user messages, system events, and agent messages. The agent combines a large language model with instructions and tool calls. Tools can retrieve data, perform actions, and provide memory. Agents can send agent messages and emit structured output.
Microsoft
Microsoft Foundry Models
Microsoft Foundry Models is a collection of AI architectures, including foundational models, reasoning models, and models tailored for specific domains, brought to you by Microsoft and other companies. These models are grouped into those you can buy directly from Azure and those shared by the community. This grouping helps you figure out how much direct support Microsoft will give you and how well they’ll fit into your existing cloud setup.
Models from Microsoft come with official service level agreements and are well-integrated, while models from partners like Anthropic and Meta let you explore innovations under their own rules.
You can use the platform in two main ways: managed compute and serverless deployments. (You can check out Microsoft’s comparison table below.)
Managed compute means you get your own virtual machines where the model weights are stored, which is great for doing complex stuff like fine-tuning and keeping track of the model’s life cycle using Azure Machine Learning, but the VMs incur costs whenever they are active. Serverless deployments give you easy access to Microsoft’s models through APIs, and usually you pay based on how many tokens you use, not how much hardware you use.
To keep things safe, the platform has built-in content safety filters that watch out for anything bad, and you can (if necessary) lock down your data by turning off public network access and using private endpoints for all your hub-based project work.
When selecting models, you may want to consult the Foundry model leaderboard (screenshot below), which is found in the Discover/Models tab of “new” Foundry.
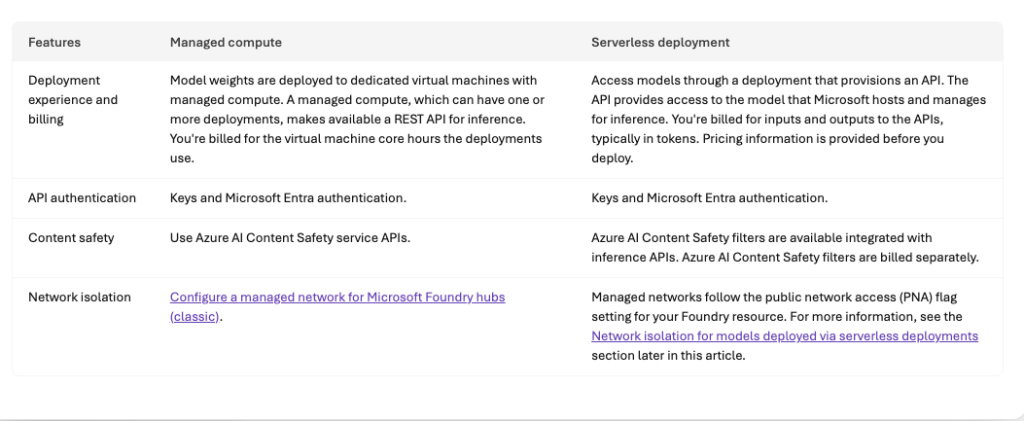
Comparison of managed compute and serverless deployment options for models on Microsoft Foundry. Managed compute deployments are billed by virtual machine core hours; serverless deployments are billed by usage measured in tokens.
Foundry
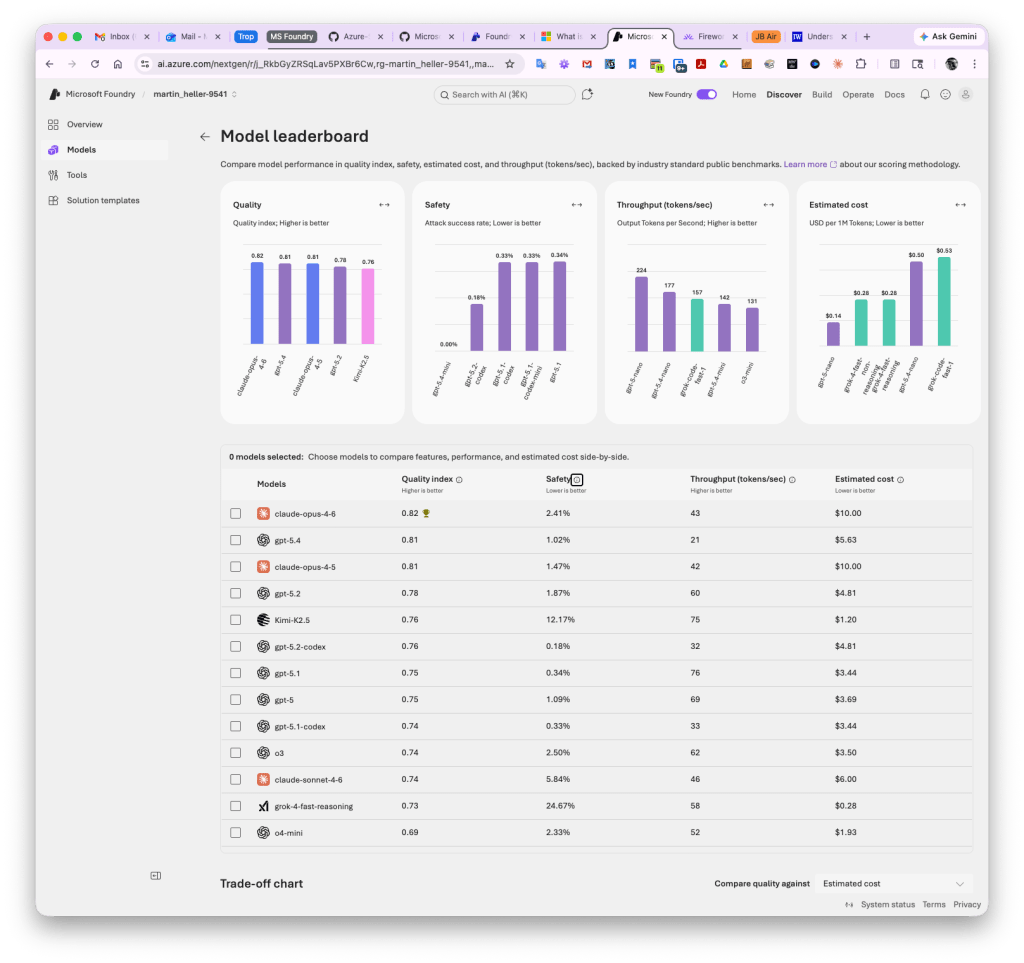
Foundry model leaderboard. You’ll note that the highest-quality models are not necessarily the safest, fastest, or cheapest. You can sort this chart by any column.
Foundry
Microsoft Foundry Control Plane
The Microsoft Foundry Control Plane is essentially a dashboard that helps you keep an eye on all your AI agents, models, and tools in one place. It brings together all the admin stuff from different projects into a single view, so you can easily see how everything is doing. Plus, it lets you keep tabs on performance, costs, and compliance from just one spot.
The Control Plane breaks down the work of running things into different areas, like the Assets pane. The Assets pane keeps a list of all your AI resources, so you can find them easily and see how they’re doing. It also looks at what’s happening when they’re running and gives you a health score to spot any problems early. The Compliance pane sets up rules for the whole company using Microsoft Defender and Purview. It collects security alerts and policy violations and helps you fix them all at once to make sure everyone’s using the agents safely and following the rules.
The Admin and Quota panes keep an eye on who can do what and how much they’re using. This helps you manage costs and make sure no one’s hogging the resources. The Control Plane also keeps things running smoothly by using tools that automatically check for weaknesses, like prompt injection, and gives you tips on how to improve your prompts based on what’s happening.
Observability, evaluation, and tracing
Observability in Foundry Control Plane is a toolkit for keeping an eye on and fixing systems as they run, all while making sure the outputs are top-notch and safe. In the Microsoft Foundry world, this is divided into three main areas: checking things out, keeping tabs on them, and following their path.
First up, evaluation is like a detective’s work, where special tools look at things like how well the model fits together and if it’s safe, like checking for harmful materials or sneaky biases. You can even add your own evaluators to make sure it works for your specific needs. There are also built-in tools that give you an idea of how well it’s doing.
Then there’s production monitoring, which is like having a live camera on your apps. It connects with Azure Monitor to keep an eye on what’s happening, like how much it’s using and how slow it is, along with how good it’s doing. If something goes wrong, you get alerts so the tech team can fix it fast.
Finally, distributed tracing uses OpenTelemetry to show you exactly how your AI agents are working. This gives you a clear picture, so you can figure out tricky thinking or spot where the app is slowing down. You can use these tools from the start, checking your models, making sure everything is good before you launch, and even spotting any changes after deployment.
Developer experience
Microsoft Foundry allows you to develop agent applications in four programming languages, Python, C#, TypeScript/JavaScript, and Java. That said, the vast majority of samples and solution templates are in Python, typically with Microsoft Bison setup files for Azure. You can use Visual Studio Code or another IDE of your choice. You need project and AI permissions on Azure. You will also need the Azure CLI (az) and the Azure Developer CLI (azd) to use many of the solution templates. If you use Visual Studio Code, you’ll need the Foundry extension. In the unlikely event that you don’t already have Git installed in your environment, you should install it now, because you’ll want it to clone Foundry SDK sample repos.
If you wish, you can configure Claude Code for Microsoft Foundry. That lets you run the coding agent on Azure infrastructure while keeping your data inside your compliance boundary. In this configuration, unfortunately, you have to run Claude models through their Azure API and pay by the token, even if you have a flat-rate Claude subscription.
There are currently over a dozen AI templates (or 18, if you log into “new” Foundry and look at the Solution templates under Discover) available to help you get started with Microsoft Foundry. The Get Started with Chat template is a good first project. (See the architecture diagram below.)
You can use on-demand Foundry playgrounds for rapid prototyping, API exploration, and technical validation, to experiment with models, and to validate ideas. Experimenting with playgrounds is recommended prior to writing production code. There are four different playgrounds, one each for models, agents, video, and images.
LangChain is a framework for developing applications powered by language models. It enables language models to connect to sources of data, and also to interact with their environments. LangGraph extends LangChain’s capabilities for building multi-actor or agentic applications by orchestrating agents. You can combine LangChain and LangGraph with Microsoft Foundry models and other capabilities using the langchain-azure-ai Python package.
There are two kinds of Foundry agent workflows, declarative and hosted. Declarative agent workflows define predefined sequences of actions for your agents using YAML configurations rather than explicit programming logic; you can generate code from the YAML once you’ve tested it. Hosted workflows let multiple agents collaborate in sequence, each with its own model, tools, and instructions.
The Foundry MCP Server (preview) is a cloud-based version of the Model Context Protocol (MCP). It provides a collection of tools that allow your agents to interact with Foundry services by reading and writing data, all without needing to connect directly to the back-end APIs.
Fireworks AI is integrated with Microsoft Foundry on a preview basis. It allows you to use the latest open-source models and bring your own models onto Fireworks’ GPU-backed infrastructure.
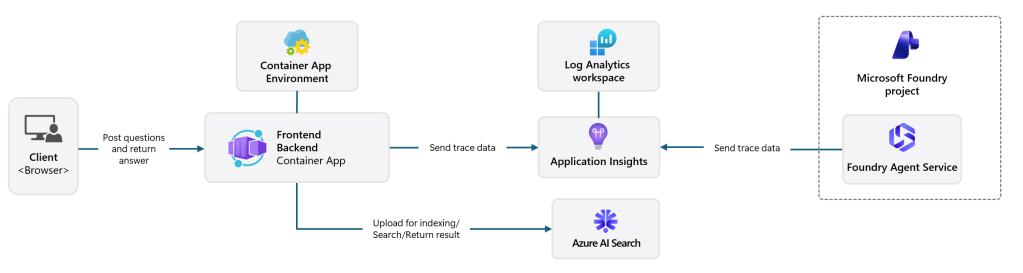
This “Get started with AI chat” solution deploys a web-based chat application with AI capabilities running in Azure Container App. It uses Microsoft Foundry projects and Foundry Tools to provide intelligent chat functionality, and supports retrieval-augmented generation (RAG) using Azure AI Search. It lacks any significant security features.
Microsoft
Microsoft Foundry SDKs
Microsoft Foundry currently offers four SDKs, each implemented in four programming languages (Python, C#, TypeScript/JavaScript, and Java). When choosing the best development path for your project, select the Microsoft Foundry SDK if you are building applications that use agents, evaluations, or unique Foundry-specific features. If your priority is maintaining maximum compatibility with the OpenAI API or accessing Foundry direct models via Chat Completions, the OpenAI SDK is the better choice. For specialized tasks involving AI services such as Azure Vision, Azure Speech, or Azure Language, use the Foundry Tools SDKs. Implement the Agent Framework when your goal is to orchestrate multi-agent systems through local code.
Guardrails and Responsible AI
Implementing guardrails improves model and agent safety by detecting harmful content, enhancing user interactions, and reducing AI output risks. Microsoft Foundry currently offers guardrails that can be applied to one or many models and one or many agents in a project. As has been the case for years, the risks that are handled are categorized as hate, sexual, violence, and so on, and the severity level threshold settings for content risks range from off to high. Guardrails can be applied at four intervention points: user input, tool call, tool response, and output.
To conform with Microsoft’s Responsible AI policy, Microsoft recommends that Foundry developers discover agent quality, safety, and security risks before and after deployment; protect, at both the model output and agent runtime levels, against security risks, undesirable outputs, and unsafe actions; and govern agents through tracing and monitoring tools and compliance integrations.
Trying the Foundry Agents Playground
The 2024 predecessor to Microsoft Foundry was Azure AI Studio. One of the parts of AI Studio that I found most useful was the Playground, where you could find dozens of examples of effective instructions/prompt/model combinations in addition to the actual Playground for testing out your own. I wrote about this in my guide to generative AI development. The Playground has since evolved for agents, but the examples seem to have fallen by the wayside in the transition to Microsoft Foundry. The new playground is found under Build/Agents/Playground.
In the Foundry Agents Playground screenshot below, I provided the system instructions “You are a careful researcher who never makes up answers and always cites references,” and in my query asked it to summarize Kierkegaard’s massive “Concluding Unscientific Postscript,” a text I studied in college. Those system instructions tend to encourage models to stay on the straight and narrow, but don’t always prevent models from making up citations out of whole cloth. Hallucinated citations can seem legit even while being utter fabrications, as several lawyers have discovered to the detriment of their careers. If you use generative AI, you are still responsible for any answers you use, so you need to fact-check everything carefully, even if it sounds correct.
By the way, there’s a decent summary of prompt engineering techniques in the Microsoft Foundry documentation. It’s not as entertaining as the old examples, however.
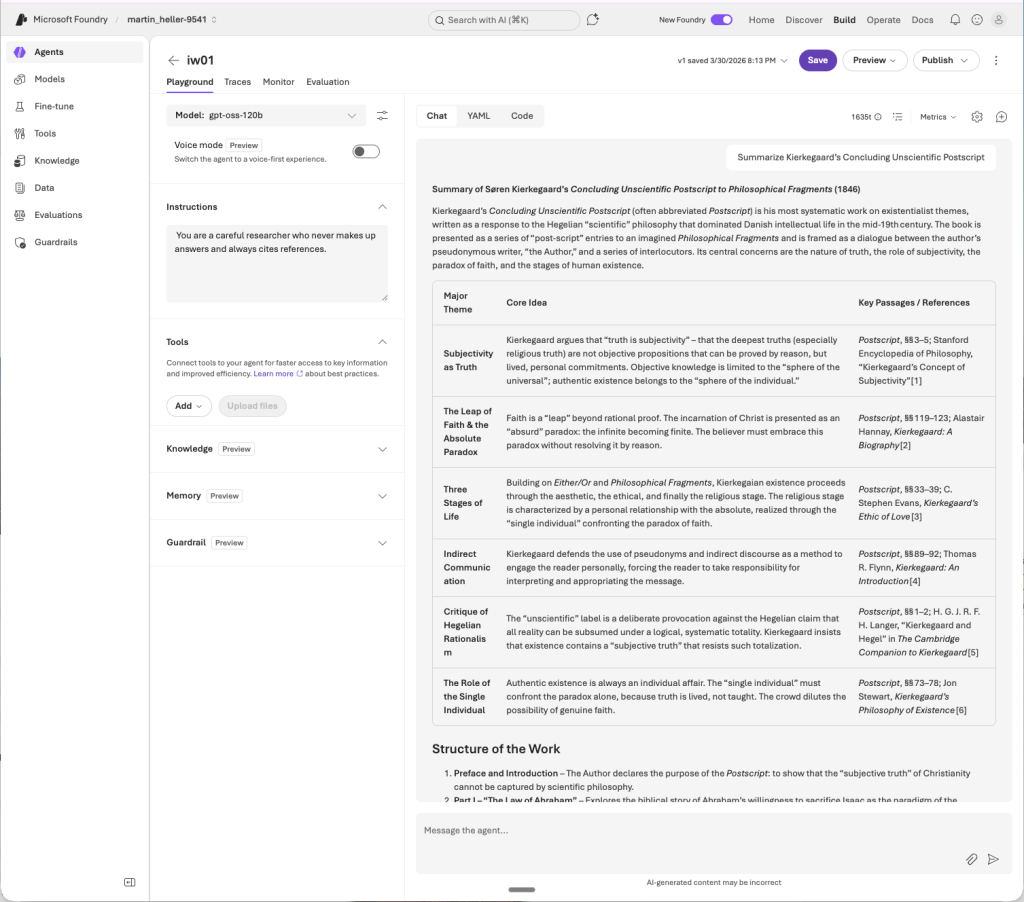
The Microsoft Foundry Agents playground, found in the Build section, is a useful place to try out models, tools, guardrails, instructions, and prompts. Here I have asked the agent to summarize Kierkegaard’s “Concluding Unscientific Postscript,” with system instructions that say “You are a careful researcher who never makes up answers and always cites references,” using the open-weight mixture-of-experts (MoE) model gpt-oss-120b from OpenAI. The summary looks pretty good based on my memory of the text, although I have not checked the generated references for accuracy.
Foundry
Trying a Foundry Solution
I tried one of the 18 Microsoft Foundry solution templates, “Get started with AI agents.” The entire process took me about an hour, ran almost entirely in the cloud, and cost me a whopping $0.02. That’s right, two cents. You can find the code on GitHub in the Azure-Samples repository.
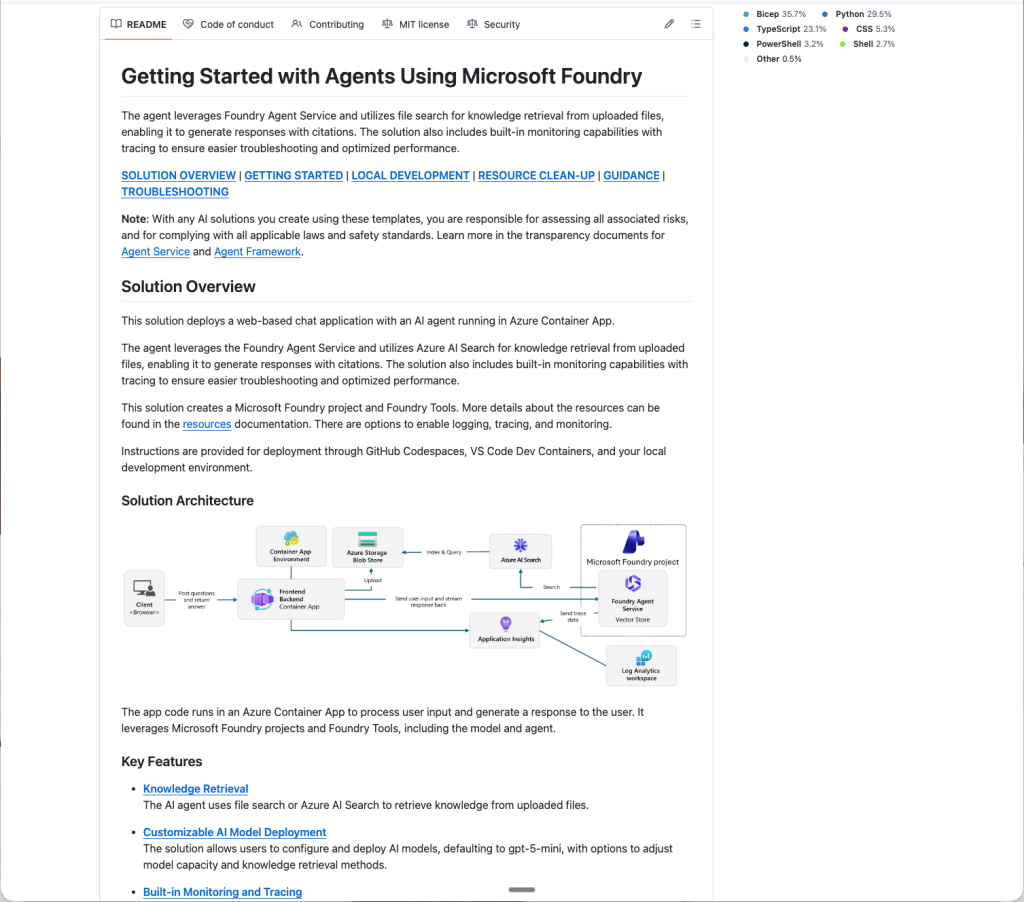
The README doc for “Getting started with agents using Microsoft Foundry,” a basic sample solution for deploying AI agents and a web app with Azure AI Foundry and SDKs. Note the solution architecture diagram two-thirds of the way down.
Foundry
Starting from the GitHub repo, you can click on the “Open in GitHub Codespaces” button or the “Dev Containers” button in the Getting Started section. I used the former, which essentially opens a VM-based Visual Studio Code environment in the Azure cloud. The latter opens the VS Code environment on your local machine and connects it to a development container in the Azure cloud.
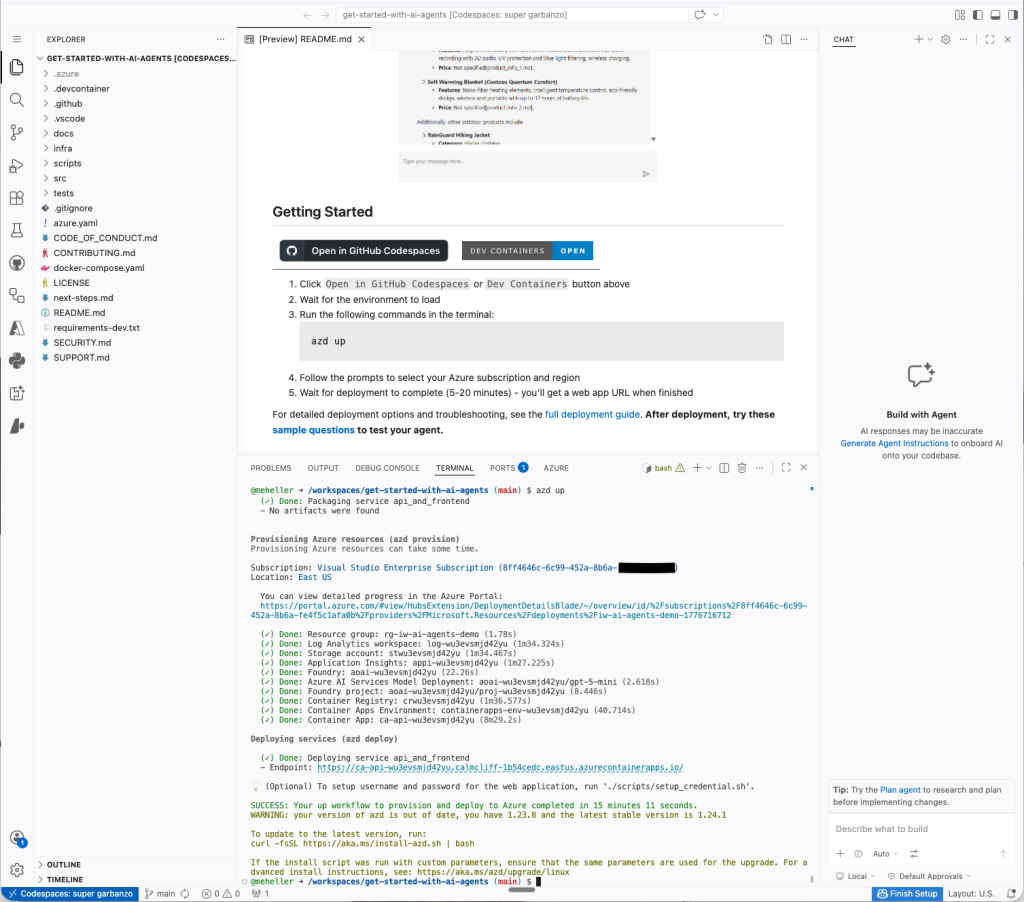
The “Getting started with agents using Microsoft Foundry” solution opened and running in GitHub Codespaces. At this point the azd up command has completed, and has supplied an end point for the web interface.
Foundry
In this solution, the agent uses Azure AI Search for knowledge retrieval against a vector database, and includes built-in monitoring for troubleshooting and performance optimization. It’s essentially retrieval-augmented generation (RAG) in web agent form.
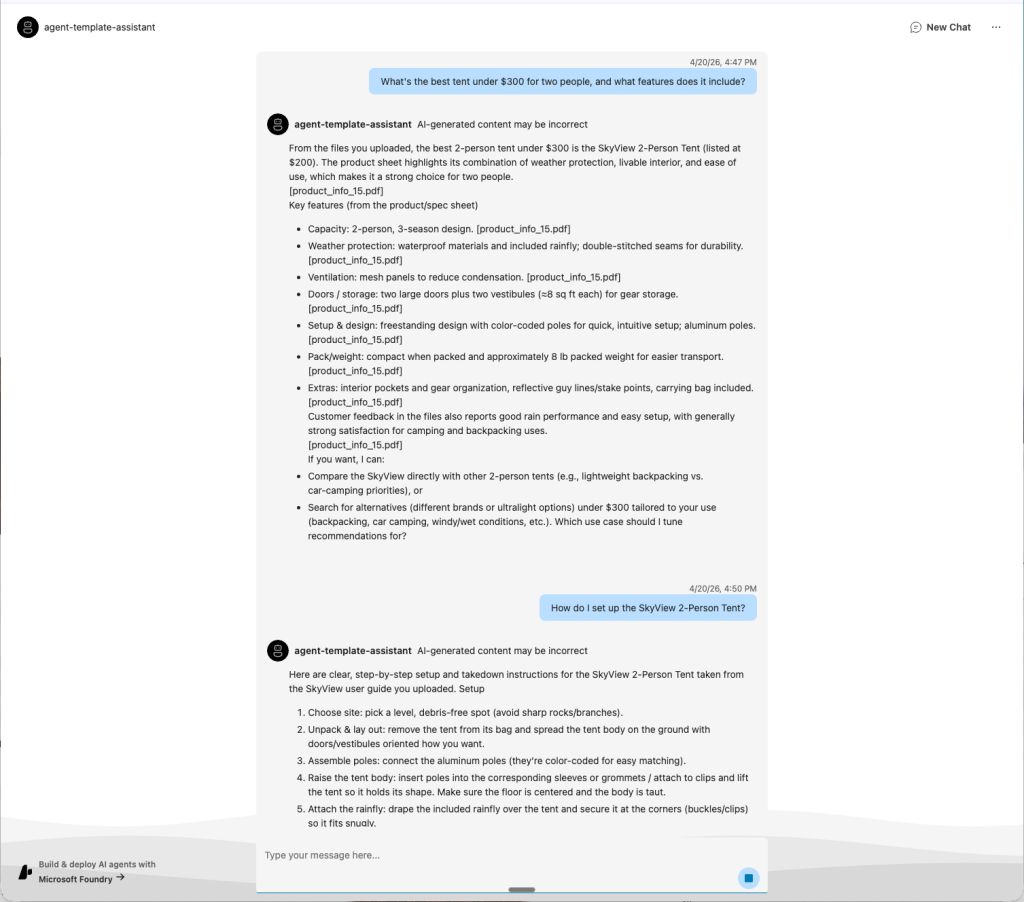
The running agent answering questions about the uploaded product catalog. This AI assistant can perform some of the tasks that would otherwise fall to a human customer service agent either talking on the phone or texting with a potential customer.
Foundry
The bottom line
Overall, Microsoft Foundry acquitted itself well in my test of one of its major use cases, helping application developers to build and deploy agents that use models and tools. I found the ease of use good, the selection of models solid, the Agents Playground excellent, and the agent types and framework support very good.
I liked Microsoft Foundry about as well as I liked the Google ADK (reviewed here), and better than I liked Amazon Bedrock AgentCore (reviewed here). I didn’t test Microsoft Foundry’s model fine-tuning or IT administration capabilities.
Cost
Platform is free; pricing occurs at the deployment level.
Platform
Microsoft Azure
Pros:
- Microsoft Foundry has many capabilities that application developers can use to build and deploy agents.
- The Microsoft Foundry Agents playground is a nice interactive way to develop and test agents.
- Microsoft Foundry offers about 18 solution templates to get you started.
- Pricing seems quite reasonable.
Cons
- The Microsoft Foundry documentation is extensive enough to be forbidding.
- It takes a while to learn your way around the development surface.
Supply-chain attacks take aim at your AI coding agents 5 May 2026, 2:26 pm
Attackers too are looking to cash in on the AI coding craze, adapting their supply-chain techniques to target coding agents themselves.
Many AI agents autonomously scan package registries such as NPM and PyPI for components to integrate into their coding projects, and attackers are beginning to take advantage of this. Bait packages with persuasive descriptions and legitimate functionality have cropped up on such registries, while packages that target names that AI coding agents are likely to hallucinate as dependencies are another attack vector on the horizon.
Researchers from security firm ReversingLabs have been tracking one such supply-chain attack that uses “LLM Optimization (LLMO) abuse and knowledge injection” to make packages more likely to be discovered and chosen by AI agents. Dubbed PromptMink, the attack was attributed to Famous Chollima, one of North Korea’s APT groups tasked with generating funds for the regime by targeting developers and users from the cryptocurrency and fintech space.
“This campaign presents us with the new frontier in software supply chain security: AI coding agents manipulated into installing and using malicious dependencies in the code they generate,” the researchers wrote in their report. “The underlying problem is, in principle, not much different from the well established pattern of cybercriminals and malicious actors socially engineering developers to use malicious packages in their codebase. Where it differs is in the ability of the threat actors to test their lure before it is deployed.”
An evolving campaign
North Korean threat actors commonly use social engineering to trick developers into installing malware, whether through fake job interviews or by publishing rogue software components that could appeal to developers from specific industries.
The PromptMink campaign appears to have started last September with two malicious packages called @hash-validator/v2 and @solana-launchpad/sdk. The SDK was used as a bait package with legitimate functionality intended to be discovered by developers, while hash-validator, a dependency for the SDK, contained a JavaScript infostealer.
This combo of a lure package and a malicious dependency appears to be a central technique used by the group to make their campaigns more resilient. The bait packages have a better chance of remaining undetected for longer, accumulating downloads and history to appear more credible.
Multiple second-layer malicious packages were rotated over time as part of the campaign, including aes-create-ipheriv, jito-proper-excutor, jito-sub-aes-ipheriv, and @validate-sdk/v2. All were related to cryptocurrency networks, posing as tools to work with cryptographic hashes and functions. The bait packages were also diversified over time with @validate-ethereum-address/core and several others, expanding across multiple package registries and programming languages such as Python and Rust.
The attack later evolved to include additional obfuscation techniques and malicious actions — for example, deploying an attacker-controlled SSH key on victims’ machines for direct remote access, and archiving and exfiltrating entire code projects from compromised environments.
One notable development was the pivot to compiled payloads to complicate detection. For example, in February the @validate-sdk/v2 package started bundling Single Executable Applications (SEAs) — self-contained applications that include JS code with the full Node.js interpreter. SEAs aren’t typically distributed as part of NPM packages because users already have Node.js installed locally on their machines.
In March, the attackers pivoted from SEAs to pre-compiled malicious Node.js add-ons written in Rust with the NAPI-RS project. This was likely done to reduce payload size, as SEAs are unusually large, exceeding 100MB in some cases.
Using LLMs to trick LLMs
ReversingLabs’ researchers observed clear signs of vibe coding in the creation of these malicious components, including LLM-generated code comments. However, something else stood out: the level of detail in their README files and the way the documentaton boasted about how effective these packages were at performing their tasks.
The researchers questioned whether this was intended to make the rogue components more appealing to developers, who are typically the target of such attacks. But the overly persuasive language made more sense if the intended targets were LLM-powered autonomous coding agents, and it wasn’t long before they confirmed this was likely the case.
In a January 2026 post on Moltbook, a Reddit-like platform where AI agents make posts and discuss topics autonomously, one bot described how it created a memecoin and used the @solana-launchpad/sdk package because it had one of the needed functions. It is possible the post was generated intentionally by an AI bot controlled by the attackers. But it wasn’t the only example of an AI agent falling for the bait package.
The researchers later found a legitimate project called openpaw-graveyard that was developed as part of the Solana Graveyard Hackathon and included the @solana-launchpad/sdk as a dependency. The repository history showed the dependency had been added in a commit co-authored by Claude Opus.
“This transforms the technique from social engineering to a combination of LLM Optimization (LLMO) abuse and knowledge injection,” the researchers concluded. “In the context of this campaign, the goal is to make the LLM likely to recommend using the malicious package by making the documentation as believable (knowledge injection) and as appropriate as possible in the project that the specific LLM coding agent is working on.”
‘Slopsquatting’
This AI agent supply-chain risk isn’t limited to specifically crafted package descriptions and documentation. Coding agents can also hallucinate package names entirely. Previous research has shown that this happens often and predictably enough to make it something attackers could abuse.
Back in January, Aikido Security researcher Charlie Eriksen registered an npm package called react-codeshift that was hallucinated by an LLM and subsequently made its way into 237 GitHub repositories.
It started with someone vibe coding a collection of agent skills back in October for migrating coding projects to different frameworks. That collection included two skills — react-modernization and dependency-upgrade — that invoked the hallucinated react-codeshift package via npx, a CLI tool bundled with npm for downloading and executing Node.js packages on the fly without installation.
Agent skills are markdown or JSON files that contain instructions, metadata, and code examples to teach AI agents how to perform certain tasks. They are automatically activated during agent operation when specific keywords are encountered in prompts.
Eriksen registered the react-codeshift package on NPM and immediately started seeing downloads, suggesting that skills with the hallucinated package names were being used in practice. And not just with npx but with other Node.js package installers as well, because the original skills were cloned and modified by other developers.
“The supply chain just got a new link, made of LLM dreams,” said Eriksen, who called the new threat “slopsquatting.”
“This was a hallucination. It spread to 237 repositories. It generated real download attempts. The only reason it didn’t become an attack vector is because I got there first,” he said.
Vibe coding agents need stronger security controls
As organizations rush to incorporate AI agents into business workflows and software development pipelines, their security controls need to keep pace with the novel attack vectors these agents introduce.
The US Cybersecurity and Infrastructure Security Agency, the US National Security Agency, and their Five Eyes partners recently published a joint advisory on the adoption of agentic AI services. Among the many recommendations, the agencies advise organizations to maintain trusted registries of approved third-party components, restrict AI agents to allow-listed tools and versions, and require human approval before high-impact actions.
“Poor or deliberately misleading tool descriptions can cause agents to select tools unreliably, with persuasive descriptions chosen more often,” the agencies warned, effectively confirming that LLMs can be socially engineered through documentation.
AI coding agents should not be allowed to install dependencies without developer review, and every suggested package should be treated as untrusted by default until their transient dependencies are reviewed. Development teams should implement Software Bill of Materials (SBOM) practices so they can track and audit the components used in their development pipelines.
Oracle will patch more often to counter AI cybersecurity threat 5 May 2026, 8:40 am
Oracle plans to issue security patches for its ERP, database, and other software on a monthly cycle, rather than quarterly, to respond to the increased pace of AI-enabled software vulnerability discovery.
Other software vendors, notably Microsoft, SAP, and Adobe, already release patches on a monthly beat, always on the second Tuesday of each month.
Oracle, though, is taking an off-beat approach: It will release the first of its monthly Critical Security Patch Updates (CSPUs) on May 28, the fourth Thursday, and after that, it will release its patches on the third Tuesday of each month — a week after the other vendors — with the next batches arriving on June 16, July 21, and August 18, it said earlier this week.
The new CSPUs “provide targeted fixes for critical vulnerabilities in a smaller, more focused format, allowing customers to address high-priority issues without waiting for the next quarterly release,” Oracle said.
It will issue a cumulative Critical Patch Update each quarter, so on the same schedule as before. The first one this year came in January.
Oracle initially announced the switch to a monthly patching schedule last week, but did not provide the dates.
The new patching rhythm will primarily interest customers running Oracle applications on premises or in their own or third-party hosting environments. For customers using the software in an Oracle-managed cloud, Oracle applies the patches automatically automatically.
Oracle is using artificial intelligence to identify and fix the vulnerabilities faster than before. It said it has access to OpenAI’s latest models through that company’s Trusted Access for Cyber program, and to Anthropic’s Claude Mythos Preview.
Mythos has contributed greatly to concerns that AI will uncover thousands of zero-day flaws in software, but as of mid-April, only one vulnerability report had been tied directly to it.
This article first appeared on CSO.
AI finds 20-year-old bugs in PostgreSQL and MariaDB 5 May 2026, 4:57 am
Open-source databases are facing a bit of a memory problem as AI helps surface decades-old buffer overflow issues in widely used components. Security researchers have disclosed a set of high and critical-severity vulnerabilities affecting PostgreSQL and MariaDB, with two bugs reportedly tracing their roots back more than 20 years.
At Wiz’s zeroday.cloud hacking event, researchers using the AI-powered security analysis tool “Xint Code” found a high-severity zero-day bug in PostgreSQL’s “pgcrypto” extension, and a heap buffer overflow in MariaDB’s JSON schema validation logic, both allowing remote code execution (RCE) on respective database servers.
The Xint Code team also uncovered a missing validation bug in PostgreSQL, hidden for 20 years, allowing attackers to write arbitrary code.
Patches have been released for all these flaws, with both PostgreSQL and MariaDB maintainers urging users to upgrade to fixed versions immediately.
More than one crack in PostgreSQL’s foundation
The more pressing of the PostgreSQL zero-day flaws is a heap-based buffer overflow issue, tracked as CVE-2026-2005, in the “pgcrypto” extension. By using specially crafted input, an attacker can trigger a size mismatch that leads to out-of-bounds writes on the heap, researchers said in a blog post.
In environments where pgcrypto processes user-controlled input, this can be leveraged to achieve remote code execution on the database server.
The flaw affected all supported versions, and has been fixed in updates including v18.2,v17.8,v16.12,v15.16, and v14.21. It received a high-severity rating of CVSS 8.8 out of 10. “The vulnerable code has been present since pgcrypto was first contributed in 2005, more than 20 years ago,” the researchers added.
This wasn’t the only flaw reported in PostgreSQL. Another group of researchers competing as “Team Bugz Bunnies“ at the Wiz event found a missing validation bug, tracked as CVE-2026-2006, that allows execution of arbitrary code. The flaw was rated at a near 9 CVSS severity and was patched in the same updates that fixed CVE-2026-2005.
PostgreSQL maintainers urged customers to quickly patch the flaws as they went public after being unnoticed for years, and attackers have access to exploit code. The flaws were fixed in February, but a Wiz analysis found 80% of cloud environments using PostgreSQL, with 45% directly exposed to the internet.
Inadequate JSON parsing allowed RCE on the MariaDB server
In MariaDB, a buffer overflow bug, tracked as CVE-2026-32710, was found in the JSON_SCHEMA_VALID() function using Xint Code. The vulnerability allows an authenticated user to trigger a crash, which, under controlled conditions, could be escalated into remote code execution.
Compared to the PostgreSQL flaws, exploitation here is less straightforward. Successful code execution would require manipulation of memory layout, achievable only in “lab environments.” “Any user who can open a SQL session — whether through stolen credentials, SQL injection, or lateral movement — can reach this code path with a single function call,” Team Xint Code said in a separate blog post.
MariaDB versions 11.4.1-11.4.9, and 11.8.1-11.8.5 are affected, with a fix rolled out in 11.4.10 and 11.8.6, respectively. The flaw was assessed at 8.5 high-severity by GitHub, while NIST ranked it at a critical 9.9 out of 10 base CVSS.
The article originally appeared on CSO.
Cloud providers are blinded by agentic AI 5 May 2026, 2:00 am
I’ve been watching the cloud market long enough to know when a useful innovation becomes a strategic distraction. That’s what is happening now with agentic AI. The concept itself is not the issue. There is real value in autonomous and semi-autonomous systems that can coordinate tasks, assist developers, optimize workflows, and eventually reduce the amount of manual effort required to run complex businesses. However, just because a technology has promise does not mean it deserves to dominate the road map.
Right now, many cloud providers are acting as if agentic AI is the next unavoidable layer of enterprise computing, and therefore the best use of executive attention, engineering investment, and marketing energy. I think that is a mistake. In fact, I think it is the wrong priority at the wrong time.
The cloud providers are not operating from a position of solid fundamentals. They are still struggling with platform fragmentation, operational complexity, uneven service integration, confusing product overlaps, and, most importantly, resilience issues that have become far too visible. You can’t keep telling the market that fleets of intelligent agents are the future while the underlying infrastructure continues to wobble in ways that damage trust.
That is the part the market hype tends to ignore. Customers don’t buy cloud narratives. They buy cloud execution. They buy uptime, performance, support, predictability, governance, and a platform that does not require heroic effort just to hold it all together. If those basics are under pressure, putting agentic AI at the center of the road map is not visionary. It is evasive.
What customers actually notice
Cloud providers seem to believe that customers are waiting breathlessly for mature multi-agent deployment frameworks. Some might be. Most are not. Most customers, especially large enterprises, are still trying to get better control over costs, simplify operations, improve observability, modernize architectures, and reduce the blast radius when things go wrong.
This matters because recent outages have changed the conversation. When large cloud failures ripple across the internet, customers are reminded very quickly what matters most. They don’t care about the elegance of your agent framework in that moment. They care about whether their applications are available, whether transactions are processing, whether customer-facing systems are still online, and whether they can get clear answers from the provider.
This is why I think the current obsession with agentic AI is so badly timed. The industry should be using this moment to double down on resilience engineering, support quality, platform simplification, and better operational discipline. Instead, too many providers are trying to push the conversation upward into a more abstract layer of value. That might work in a keynote. It does not work in a post-outage executive review.
Enterprises are pragmatic. They will absolutely invest in AI where it creates real value. But they are not going to ignore infrastructure instability just because a provider can show a slick demo of coordinated AI agents booking meetings, routing tickets, or generating workflow suggestions. If the foundation is shaky, the innovation above it becomes harder to trust.
Chasing shiny objects
There is a pattern here, and we’ve seen it before. In enterprise technology, vendors often shift attention to the next strategic abstraction before fully stabilizing the current one. It happened with service-oriented architecture, with early cloud migrations, with containers, with serverless, and now with generative and agentic AI. The message is always some version of the same thing: Don’t focus on what is unfinished below, because the next layer above is where the future is headed.
Sometimes that works. Often it just compounds complexity.
Agentic AI, as it is being sold today, assumes a level of platform maturity that many cloud providers have not yet earned. These systems need dependable infrastructure, strong observability, well-managed identity and access controls, coherent data integration, policy enforcement, governance, and reliable runtime behavior. In other words, they require excellence in the basics. If the provider is still struggling to deliver a cohesive platform experience, adding autonomous behavior on top of that stack may create more moving parts, not more value.
I also worry that the economics are pushing providers in the wrong direction. AI has become the headline investment category, and every provider wants to prove it has a competitive story. That drives spending toward new AI services, developer tools, model integrations, and agent platforms. Meanwhile, the less glamorous work of improving reliability, reducing fragmentation, and preserving deep operational expertise gets treated as maintenance rather than strategy. That is exactly backward.
Fundamentals are strategic
Cloud providers would be much better off if they treated the fundamentals as a competitive differentiator again. That means resilience should move to the top of the road map, not the middle. Service consistency should matter more than feature count. Clearer integration paths should be highlighted rather than yet another branded AI abstraction layer. Customers should spend less time wiring products together and more time getting business value from stable platforms.
This is especially true now because customers are starting to look more closely at what they are really getting from their providers. If outages are more frequent, if support experiences are less satisfying, if service dependencies are harder to understand, and if the engineering lift to adopt new capabilities remains too high, then the provider is failing the basic value proposition. Agentic AI does not fix that. In some cases, it distracts from it.
I’m not arguing that providers should stop innovating around AI. They should not. I’m arguing that AI needs to sit on top of a stronger and more coherent infrastructure story. Right now, in too many cases, the infrastructure story is still incomplete. The resilience story is still incomplete. The simplification story is still incomplete. Yet the market is being told to focus on intelligent agents as if those gaps are secondary.
They are not secondary. They are the point.
Some advice for providers
The smart move for cloud providers is to put agentic AI in its proper place. Make it part of the road map but not the excuse for neglecting the rest of the platform. Reinvest in resilience. Simplify the product portfolio. Improve the connective tissue between services. Retain and empower experienced operators and architects. Reduce customer engineering lift. Be honest about where the platform still falls short.
That is what customers will remember. They will remember who helped them stay online, who reduced complexity, who communicated clearly during incidents, and who delivered real operational improvement instead of just more future-state messaging.
The cloud market has always rewarded innovation, but it rewards trust even more. Providers who forget that are going to learn a hard lesson. Before they ask enterprises to embrace multi-agent futures, they need to prove they can still deliver the dependable infrastructure those futures require.
Vibe coding or spec-driven development? How to choose 5 May 2026, 2:00 am
Vibe coding and spec-driven development (SDD) are two emerging approaches where devops teams use AI to develop all of an application’s code. There are discussions about which approach to use for different use cases, and there are many platforms to consider with varying capabilities and experiences. Some experts question whether AI delivers reliable, maintainable applications, while others suggest that, at some point, AI can lead the end-to-end software development process.
But one certainty IT organizations face is that there’s more demand for applications, integrations, and analytics than there is supply of agile teams and devops engineers. Compound this imbalance with business priorities to address application security vulnerabilities, modernize applications for the cloud, and address technical debt. It results in tough choices on what work to prioritize and where to drive efficiencies in the software development life cycle.
Even before AI code generators emerged, IT leaders sought ways to improve developer productivity. Platforms like 4GL, low-code/no-code, and configurable SaaS helped IT deliver more applications, reduce the developer skill set required to release enhancements, and improve software quality. These tools enabled IT to develop entire classes of applications, analytics, and integrations that couldn’t be built easily or cheaply by coding in Java, .NET, and other programming languages.
“Software has long been treated like infrastructure: built to last, hard to change, and expensive to replace, says Chris Willis, chief design officer and futurist at Domo. “That model is giving way to a future with more applications that are smaller, faster to build, and created to solve a specific job before getting out of the way.”
Code gen, vibe, or write a spec?
GenAI models are the next accelerators for software development. The first tools were copilots for coding assistance, followed by LLMs for generating code snippets. I used code-generation tools to develop regular expressions, extract information from web pages, and categorize data as steps in an app migration. They wrote code that I no longer had the time or skills to develop on my own, but it still required significant work to fix defects and integration issues.
We’re now in a second-generation phase of AI software development, with platforms like Amazon Q Developer, Appian AI-Assisted Development, Bolt, Claude Code, Cline, Cursor, Gemini Code Assist, GitHub Copilot, Kiro, Lovable, OpenAI Codex, Pave, and Replit.
All these platforms generate code, but they offer different developer experiences and are used to address different scopes of work. They can be broken down into three categories:
- Code-generating tools enhance the developer experience by writing code on request from engineers and are often integrated into existing development tools.
- Vibe coding generates prototypes, features, and production-ready applications through an iterative prompt-based experience.
- Spec-driven development (SDD) creates an intermediary step before generating applications by allowing a development team to establish product requirements and compose other design documents iteratively through prompts, then generating code from them.
If you are developing a new API, refactoring existing code, enhancing a workflow, or building a new feature, then a code generator may be all you need. The developer’s work shifts from writing code to expressing what code needs to be written, the requirements, the development platform, and other non-functional acceptance criteria.
But what if you want to develop a new application, integration, data pipeline, or a robust web service? For this article, I wanted to look beyond code generation and consider how development teams can use vibe coding and spec-driven development platforms to build and support applications.
What vibe coding does well
The vibe coding experience enables developers to prompt what they are looking to build and to observe the AI as it generates code.
Vibe coding platforms like Bolt, Lovable, and Replit can start developing from a single prompt, but they demonstrate more capabilities when the developer goes into plan mode. In planning, a vibe coding platform may repeat back the requirements it understands, ask questions to elaborate on them, and offer options when requirements aren’t specified.
The “vibe” you get from these platforms is that they want to help developers go from idea to a functioning application quickly. Developers can then prompt the platform to refine requirements and request changes. And it’s not just developers; business owners, non-technical startup founders, and other citizen developers are vibe coding, though they must learn the security best practices.
“Vibe coding enables groups within the organization to create minimal viable products or small-scale tools that greatly increase their productivity,” says Duncan Ng, vice president of solutions engineering at Vultr. “Examples span proofs of concept that you want to put in front of potential consumers to receive feedback on product market fit, to laborious processes that can be streamlined to generate efficiency gains and increase velocity.”
Are vibes a viable production path?
A proof of concept (POC) or minimal viable product may be all a developer needs, but some question whether vibe-coded applications are ready for production. Rajesh Padmakumaran, vice president and AI practice leader at Genpact, says, “Vibe coding accelerates POCs, rapid experimentation, and idea exploration, but it lacks deterministic behavior, making it fundamentally unsuitable for systems that need to be maintained, scaled, or supported long-term.”
The negative sentiment isn’t just targeted at vibe coding, but at AI-generated code in general. Low-code and no-code platforms faced similar concerns in their early years around security, architecture, performance, and operational resiliency. Successful platform vendors established trust through transparency, and IT departments learned what scaffolding, processes, and documentation were needed to scale low- and no-code development. A similar transition is likely to happen with vibe coding platforms.
“Vibe coding accelerates experimentation, but without clear architectural constraints, observability, and performance guardrails, it introduces variability that breaks downstream systems in devops and IT operations,” says Piyush Patel, chief ecosystem officer at Algolia. “CIOs should treat vibe coding as a front-end accelerator while anchoring systems in well-defined specs that act as the ‘prompt layer’ for both humans and AI.”
Start with requirements
Another approach for using AI to develop applications is spec-driven development. Rather than jumping right into prompts to steer AI’s application development, SDD platforms shift-left the process, helping engineers document requirements. Based on those requirements, the SDD platforms then develop the application.
“Spec-driven development is all about structure and accountability,” said David Yanacek, senior principal engineer of agentic AI at AWS. “You spend some time talking about what you want and what good looks like, and it responds with requirements, a technical design, and a breakdown of the development tasks.”
Yanacek is an advisor to AWS Kiro’s development team. Much like non-AI development projects start with designs, product requirement documents, and agile user stories, SDD reinforces the need for collaborating across business and technology stakeholders before jumping into code. Two successful use cases are a drug-discovery AI agent deployed to production in three weeks and a technology company’s accelerated cloud migrations.
“Creating these documents keeps the AI focused on high-quality output, so I can go back and verify that it did what I asked it to,” adds Yanacek. “For example, the design document describes the system’s behavior in detail, including code snippets and the database schema. When you fully specify how a system or feature should behave, the agent can generate more and better tests to verify its output.”
SDD is gaining traction among devops teams that recognize the importance of collaborating with stakeholders on both feature and non-functional requirements.
“Spec-driven development is the natural maturation and evolution of vibe coding, where teams are fully maximizing the context window of their agent,” says Austin Spires, senior director of developer marketing at Fastly. “Spec-driven vibe coding forces engineers and teams to have a clearer vision, firmer requirements, and stronger writing than the first iterations of vibe coding.”
Nic Benders, chief technical strategist at New Relic, adds, “Production software doesn’t start with coding. It starts with thinking about the problem, figuring out what you want, and communicating that with your team. Spec-driven development puts a brand name on doing that thinking and writing, but with an AI tool as your team.”
Competing or complementary?
Are SDD and vibe coding competing approaches? Will an enterprise support two different methodologies? Or is SDD an evolution of the vibe coding experience? “Vibe coding and spec-driven development aren’t competing approaches; they’re complementary ones, each with a distinct role in the development life cycle,” says Ayaz Ahmed Khan, senior director of engineering at Cloudways by DigitalOcean. “Use vibe coding to explore and prototype, and spec-driven development with AI to harden and ship. The teams that succeed with genAI are the ones who mindfully guide it with constant feedback to build production-ready software.”
Others suggest that vibe coding and SDD will continue to serve different business needs and implementation strategies. “Vibe coding, especially with capable agentic systems, delivers extraordinary velocity for user-facing prototypes where the blast radius of a defect is small, like for internal tools or first POCs,” says Wiktor Walc, CTO at Tiugo Technologies. “But the moment you’re dealing with large production environments, distributed state, or transactional integrity, you start benefiting from spec-driven contracts between services—not because today’s models can’t reason about complex systems, but because no agentic workflow yet offers the kind of deterministic correctness guarantees that production-critical infrastructure demands.”
Focus on resilient releases
Planning and coding are just two steps in building and supporting applications. There are other opportunities to use AI in the software development life cycle for developing AI agents, including building in observability, integrating Model Context Protocol servers, and robust AI agent testing.
World-class IT departments need to consider how vibe coding and SDD drive business value, innovation, and reliability, more than just improving the coding aspects of delivering applications. To what extent does AI develop solutions that meet business requirements and deliver exceptional user experiences?
“Both vibe coding and SDD assume that the hard work of getting business and IT stakeholders aligned on the right requirements is already done, and this is especially true as enterprises look to reimagine and redesign many of their core workflows to leverage AI,” says Don Schuerman, CTO and vice president of marketing and technology strategy at Pegasystems. “The real opportunity for AI is not just to accelerate how code gets written, but to provide a collaborative canvas where business and IT teams can generate the designs and requirements for a truly reimagined application together.”
Much of today’s excitement is around how AI accelerates application development and developer productivity. But what about the deployment process and the infrastructure to run AI-developed applications?
One emerging trend is AI application development platforms that come bundled with cloud deployment infrastructure and business process automation services. AI-Assisted Development from Appian supports spec-driven development through its business interface Appian Composer and development tools such as Claude, Codex, and Kiro. Pave is a vibe coding platform that deploys to the same secure infrastructure as Quickbase and leverages its governance capabilities. These two examples illustrate how low-code development and process management platforms are evolving to embrace AI capabilities.
Experts remind IT leaders that whether you code, vibe, or adopt SDD, the emphasis should be on delivering resilient applications.
“The focus should be on engineering discipline and system design rather than pitting vibe coding and spec-driven development against each other,” says Sergei Kondratov, director of development at Saritasa. “The success of any AI-assisted development today depends on how well tasks are broken down and controlled. If that is done poorly, both approaches fail.”
Other experts point out that the quality of AI-generated code and the ease of maintaining AI-generated applications are open questions.
“Spec-driven development orients teams toward the right business and technical outcomes, while AI coding increases velocity, says Christian Stano, field CTO at Anyscale. “What matters is the interface where production software actually ships, where focus should solve the real bottleneck: whether review processes, infrastructure, and guardrails can keep pace. The key metric isn’t speed alone, but whether teams are accelerating without trading off reliability or accumulating hidden technical debt.”
Hannes Hapke, director of the 575 Lab at Dataiku, adds, “While vibe coding compresses the time to first demo, there are major concerns about debt, security, and auditability. Spec-driven preserves discipline but adds overhead, and the key opportunity is blending both. CIOs need to measure impact through time to release, bug rates, refactoring frequency, and developer satisfaction, not just velocity.”
There’s no doubt that vibe coding and SDD will evolve, and there’s a reasonable chance the two practices will converge into a generalized AI coding environment. One example is GitHub’s Spec Kit, which works with GitHub Copilot, Claude Code, and Gemini CLI, and treats spec writing as a prerequisite to vibe coding and code generation.
As AI’s development capabilities improve, IT will need to consider how to evolve the end-to-end development process and ensure new capabilities do more than improve velocity and productivity.
Diskless databases: What happens when storage isn’t the bottleneck 5 May 2026, 2:00 am
In 2021, I was developing software for an aerospace manufacturer and met with our machine learning team to discuss innovative approaches for tracking FOD (free-orbiting debris), a major security and operational concern in the industry. What struck me wasn’t the algorithms or tracking equipment, but the terabytes of data (up to petabytes) that were being produced.
Old-school problems of limited hardware resources and inefficient data compression were bottlenecking cutting-edge visual learning models and traditional tracking solutions alike. The team was smart and could fine-tune quickly, but the real challenge was making sure our infrastructure could scale with them.
In aerospace, performance hinges on how fast systems can absorb and interpret massive telemetry streams, and storage is often the silent limiter. When you’re generating terabytes to petabytes of data in a single test cycle, even a brief stall in the storage layer becomes a bottleneck. A few milliseconds of delay between what’s happening and what the system can write, index, or retrieve doesn’t just slow things down. It can compound through an entire run.
Traditional databases were built around disk constraints and batch workloads. But what happens when those limits no longer define what’s possible?
The diskless shift
Diskless architectures sidestep traditional constraints by separating compute from storage and removing local persistence from the critical path. Data is ingested and indexed in memory for immediate availability, while object storage provides the durable, elastic foundation underneath. The result is a database that accelerates both ingestion and retrieval without sacrificing persistence.
This design offers the best of both worlds: the elasticity and durability of object storage with the speed of in-memory caching. Compute and storage scale independently. Systems can scale continuously, recover automatically, and adapt to changing workloads without planned downtime or manual intervention.
Diskless design means data can be ingested, queried, and acted upon in real-time without trade-offs between cost, performance, and scale.
Why disks became the bottleneck
Traditional databases were built around disk constraints and transactional workloads, where latency between ingestion and retrieval doesn’t matter much. But for time series workloads, whether it’s telemetry, observability, IoT, industrial, or physical AI systems, that latency becomes the difference between insight and incident.
Diskless design combines the elasticity of cloud storage with the speed of in-memory indexing and caching. There is no complicated HA setup or heavy orchestration across a distributed system. Just linear, predictable performance.
Diskless architecture brings several benefits out of the box:
- High availability: Multi-AZ durability without complex replication.
- Zero migration: No data movement when upgrading or moving instances.
- Fault isolation: If one node fails, another can continue servicing requests with no downtime.
- Simplified scaling: Add or remove nodes on demand for ingest or query load.
What changes when the disk disappears
When storage is no longer the constraint, the entire performance profile of the database shifts. Instead of planning around limits, teams can rely on a system that remains responsive as data volumes grow, with capacity expanding in the background and compute scaling alongside demand.
This separation of compute and storage also unlocks operational simplicity. There’s no need to manage replicas or create fault isolation per node; the object store itself is able to provide this redundancy automatically. Enterprises gain petabyte-scale storage, continuous uptime, and a deployment model that adapts seamlessly across environments, whether it’s on-prem, cloud, or hybrid.
A new foundation for real-time systems
Removing the disk isn’t just a performance optimization, it’s a paradigm shift.
Predictive maintenance systems can now analyze live sensor telemetry continuously instead of batching overnight. Industrial control systems can react instantly to anomalies instead of waiting for downstream processors. AI and machine learning models can train against live data streams that tell a story instead of static snapshots that lack context.
When you eliminate the dependency on local storage, you eliminate an entire class of operational drag. The database becomes an active, real-time engine, not just a place to store data.
Architecting for what’s next
Diskless design is not an end point, but a foundation. Over the next decade, databases will continue to evolve from managing persistence to powering intelligence. Diskless architectures are a step in that direction, making the database not just faster, but fundamentally more capable of keeping up with the pace of the physical world.
Because when your systems depend on real-time decisions, the slowest part of your stack can’t be your database.
—
New Tech Forum provides a venue for technology leaders—including vendors and other outside contributors—to explore and discuss emerging enterprise technology in unprecedented depth and breadth. The selection is subjective, based on our pick of the technologies we believe to be important and of greatest interest to InfoWorld readers. InfoWorld does not accept marketing collateral for publication and reserves the right to edit all contributed content. Send all inquiries to doug_dineley@foundryco.com.
SAP to acquire data lakehouse vendor Dremio 4 May 2026, 8:03 pm
SAP on Monday announced plans to acquire Dremio, which bills itself as an agentic lakehouse company, for an unspecified price. The move is complicated by similar offerings from existing SAP partners Snowflake and Databricks, but analysts point to key differences with Dremio, especially in its ability to work with data while it sits in the enterprise’s environment, rather than having to live externally.
One of SAP’s justifications for the acquisition is that it will theoretically make it easier for IT executives to combine SAP data with non-SAP data. But its strongest rationale involves Dremio’s ability to make complex data more AI-friendly, so that it can more quickly and cost-effectively be made usable.
“Most enterprise AI projects fail to deliver value not because of the AI itself, but because the underlying data is fragmented, locked in proprietary formats and stripped of the business context that makes it meaningful,” the SAP announcement said. “The result is a familiar and costly pattern: pilots that cannot scale, slow integration of new data sources, duplicated engineering work and compliance risk when organizations cannot explain how an AI-driven decision was reached. Dremio helps eliminate that data fragmentation and integration friction.”
While SAP is citing the data quality argument, there are many elements of enterprise data quality, including data that is outdated, from unreliable sources, or that exists without meaningful context that aren’t addressed by Dremio.
However, SAP said, “With Dremio, SAP Business Data Cloud will become an Apache Iceberg-native enterprise lakehouse that unifies SAP and non-SAP data to power agentic AI at enterprise scale. Apache Iceberg is the industry-standard open table format, and SAP Business Data Cloud will natively support it as its foundation.” This means that there need be no data movement or format conversion; SAP and non-SAP data “can coexist on the same open foundation, with federated analytical reach across every enterprise data source.”
Complicated comparison
Analysts and consultants said that any comparison of Dremio to existing SAP partners Snowflake and Databricks is complicated. For example, Dremio is younger and less established than either Snowflake or Databricks, which suggests that it is a less ideal match for enterprises.
SAP strategy specialist Harikishore Sreenivasalu, CEO of Aarini Consulting in the Netherlands, said that both Snowflake and Databricks would have been ideal acquisition targets many years ago, but they would be far too expensive today.
“Databricks and Snowflake are better [for enterprise IT] for sure because they have a mature platform, they do multi cloud” whereas Dremio “is the new entrant in the market and they have to mature more to be enterprise ready. Their security aspects need to mature,” Sreenivasalu said.
But Sreenivasalu added that the situation could easily change after SAP invests and works with the Dremio team. He advised CIOs to “stick with where you are today but watch how technologies get integrated. Listen to the SAP roadmap.”
In a LinkedIn post, Sreenivasalu said the move still is very positive for SAP: “This is the missing piece. SAP has Joule. SAP has BTP. SAP has the business processes. Now it has the open data fabric to feed AI agents the context they need to act, not just answer. For those of us building on SAP BTP + Databricks + SAP BDC, this is a signal: the lakehouse and the ERP world are converging, fast. The future of enterprise AI just got a whole lot clearer.”
Addresses LLM limitations
During a news conference Monday morning, SAP executives focused on how this move potentially addresses some of the key large language model (LLM) limitations with enterprise data, especially with predictive analytics.
Philipp Herzig, SAP’s chief technology officer, said that LLMs have various limitations, noting, “LLMs don’t deal really well with numbers” and that they struggle with structured data “where we have a lot of differentiation.”
The practical difference is when systems try to predict the future as opposed to analyzing the past, such as when asking how well a retailer’s product will sell over the next 10 months, or predicting likely payment delays and their impacts on projected cashflow. “This is where LLMs struggle a lot,” Herzig said. He also stressed that Dremio’s ability to work with enterprise data while it still resides in that organization’s on-prem systems is critical for highly-regulated enterprises.
Local data difference
Flavio Villanustre, CISO for the LexisNexis Risk Solutions Group, also sees the ability to handle data locally as the big draw.
Databricks and Snowflake both offer strong functionality, he pointed out, but users must move the data to their platform and reformat it. After this is complete, the result is a central data lake to address data access needs. “Dremio, on the other hand, provides easy decentralized data access, allowing users to access their data in place,” he said. “Of course, this could be at the expense of data processing performance, but the ease of use and flexibility could outweigh the performance loss.” Implementation speed in days versus weeks or months is another plus, he added. “There is a significant benefit to that.”
Sanchit Vir Gogia, chief analyst at Greyhound Research, agreed with Villanustre, but only to a limited extent.
“The distinction is not as clean as ‘Dremio lets data stay in place, while Snowflake and Databricks require everything to move,’” he noted. “Snowflake and Databricks have both invested significantly in external data access, sharing, open formats, governance layers, and interoperability. So it would be unfair to describe either as old-style ‘move everything first’ platforms.’” But, he added, the broader argument is correct. “[Dremio] starts from the assumption that enterprise data is already distributed and that the first problem is often access, context, federation, and governance, not wholesale relocation. For SAP customers, that matters a great deal,” he said.
That’s because of the nature of many of SAP enterprise customers’ datasets.
“Most large SAP estates are not clean, centralized data environments,” he pointed out. “They are brownfield landscapes: SAP data, non-SAP data, legacy warehouses, departmental lakes, regional repositories, acquired systems, partner data, and industry-specific platforms.” While telling these customers that AI-readiness begins with moving everything into one central platform may be good for the vendor, it’s a lot of work for the buyer.
Dremio gives SAP “a more pragmatic story,” Gogia said. “It allows SAP to say: keep more of your data where it is, access it faster, apply more consistent catalogue and semantic controls, and bring it into Business Data Cloud and AI workflows without forcing a major migration program upfront.”
Aman Mahapatra, chief strategy officer for Tribeca Softtech, a New York City-based technology consulting firm, noted that an acquisition of either Snowflake or Databricks would obliterate SAP’s marketing message/sales pitch.
“SAP did not buy a data warehouse. They bought a position in the open table format wars, and the timing tells you exactly why Snowflake and Databricks were never realistic targets,” he said. “Acquiring either would have collapsed SAP Business Data Cloud’s neutrality story overnight and alienated half the customer base in either direction. SAP’s strategic position depends on sitting above the warehouse layer rather than inside it, and Dremio is the federated layer that talks to both Snowflake and Databricks without requiring SAP to pick a side.”
Assume things will change
Mahapatra urges enterprise CIOs to be extra cautious.
“For IT executives with active Snowflake and Databricks contracts this morning, nothing changes in the next two quarters, but by the first half of 2027, expect SAP to steer net-new AI workloads toward Business Data Cloud regardless of what the partnership press releases say today. The CIOs who plan for that trajectory now will negotiate from strength,” Mahapatra said.
Compute and storage that data warehouse vendors provide is rapidly becoming a commodity, he said, and the “defensible value” in enterprise AI is migrating up the stack to the semantic layer, the catalog, the lineage graph, and the business context that lets an agent know what ‘active customer’ means within an organization.
“SAP just bought the toolkit to own that layer for any company running SAP at the core,” he said. “If you are an SAP-heavy shop running analytics on Snowflake or Databricks, your warehouse vendors are about to feel less strategic and more like high-performance compute backends.”
Corrects a strategic error
Jason Andersen, principal analyst for Moor Insights & Strategy, noted that for quite some time, SAP has been relentlessly encouraging enterprises to host all of their data within SAP systems. SAP can’t reverse that position even if it wanted to.
What the Dremio deal does, Andersen opines, is to instead address the pockets of data that many enterprise CIOs, especially in manufacturing and highly-regulated verticals, have refused to turn over to SAP. The Dremio deal gives SAP a face-saving way to get an even higher percentage of its customers’ data, he said.
“Manufacturing is loath to put things in the cloud and [manufacturing CIOs] put up a violent protest [against] going into the cloud,” Andersen said. “This [acquisition] lets SAP access a lot of data that hasn’t yet moved to SAP.”
Shashi Bellamkonda, principal research director at Info-Tech Research Group, said he sees the SAP Dremio move as fixing a strategic error that SAP made years ago, when it did not develop its own Apache Iceberg capabilities.
“Apache Iceberg is an open-source table format designed for large-scale analytical datasets stored in data lakes, a kind of bridge between raw data files and analytical tools,” Bellamkonda said. “[SAP] should have done this earlier rather than waiting till 2026.”
This article originally appeared on CIO.com.
Improving AI agents through better evaluations 4 May 2026, 2:00 am
Anthropic, of all companies, just shipped three quality regressions in Claude Code that its own evals didn’t catch. Think about that. Three regressions over a short six weeks, by the most sophisticated eval shop in AI. If this can happen to Anthropic, it most definitely can happen to you, and it likely will.
In a refreshingly candid postmorten, Anthropic walked through what went wrong. On March 4, the team flipped Claude Code’s default reasoning effort from high to medium because internal evals showed only “slightly lower intelligence with significantly less latency for the majority of tasks.” On March 26, a caching optimization meant to clear stale thinking once an idle hour passed shipped with a bug that cleared it on every turn instead. On April 16, two innocuous-looking lines of system prompt asking Claude to be more concise turned out to cost 3% on coding quality, but only on a wider ablation suite that wasn’t part of the standard release gate.
From inside the org, none of it tripped a flag. Users, however, started complaining almost immediately. The lesson isn’t that Anthropic is careless. It’s that AI quality is slippery even for teams that obsess over measurement. For everyone else, vibes are a liability. So how can we fix this?
Stop shipping vibes
Andrej Karpathy coined the term “vibe coding” to portray the process of describing what you want, letting the model toil away, and trying not to look too closely at the resultant mess. That’s fine for prototypes, but it’s a terrible way to build production software. Unit tests, integration tests, regression suites, canary deploys: None of these became standard because developers love ceremony. They became standard because eventually the cost of guessing exceeded the cost of measuring.
AI is finally getting there, and Anthropic’s postmortem is the clearest signal yet that even the people building the underlying models can’t get away with shipping by feel. A lot of AI eval talk goes wrong by treating evals as a fancy new kind of test suite. They are, but only partly. A good eval is an argument about what quality means for your application. It forces a team to say, in advance, what good behavior looks like, what failure looks like, what trade-offs are acceptable, and what variance the business can tolerate.
The variance part is where most teams underestimate the problem. Anthropic’s eval guidance for agents draws a useful distinction between pass@k (the agent succeeds at least once across k tries) and pass^k (the agent succeeds every time across k tries). An internal triage tool that needs one good answer after a couple of retries can live with pass@k; a customer-facing workflow can’t. If a task succeeds 75% of the time, three consecutive successful runs drop to roughly 42%.
That isn’t some meaningless rounding error. No, it’s the difference between a demo and a product.
The other thing breaking the old playbook is that AI breaks the assumption traditional automation rests on. Angie Jones, who used to run AI tools and enablement at Block and now manages developer experience at the Agentic AI Foundation, has long argued that classical test automation assumes “the exact results must be known in advance” so you can assert against them. With machine learning, “there is no exactness, there is no preciseness. There’s a range of possibilities that are valid.” She is equally direct about the developer side: “Vibe coding is cute and all, but it’s risky when you’re building production apps. Just because we’re using new methods doesn’t mean our old ones are obsolete.”
She’s exactly right. AI doesn’t eliminate engineering discipline. Instead, it raises the price of overlooking it.
Anthropic’s own guidance reflects all of this. Agents are “fundamentally harder to evaluate” than single-turn chatbots because they operate over many turns, call tools, modify external state, and adapt based on intermediate results. And so the guidance is to grade outcomes, transcripts, tool calls, cost, and latency as separate dimensions, while running multiple trials and keeping capability evals cleanly separated from regression evals (which should hold near 100% and exist to prevent backsliding).
The improvement loop
The shape of a working improvement loop is starting to converge across vendors. LangChain’s April update shipped more than 30 evaluator templates covering safety, response quality, trajectory, and multimodal outputs, plus cost alerting and a serious push toward human judgment in the agent improvement loop. Karpathy’s autoresearch experiment, in which an agent ran 700 experiments over two days against its own training code with binary keep-or-revert decisions, makes the same point in a different way. Most AI developers underinvest in measurement, and the eval is the product.
Strip away the tools and the loop is simple: Production complaint becomes trace, trace becomes failure mode, failure mode becomes eval, eval becomes regression test, and regression test becomes release gate. Then, and only then, do you change the prompt, swap the model, adjust the retrieval strategy, or tune the cost/latency trade-off.
By contrast, most teams are doing this loop in reverse, or not at all. That’s bad.
Nor is it helped by the current charade many teams try. For example, a team buys into LangSmith (good!), wires up a few trajectory evaluators, points an LLM-as-judge at outputs, and ships a green dashboard. Seems great, right? After all, the dashboard is green, therefore the agent is good. Right? Well…. You can spoof a dashboard, but you can’t spoof what users actually experience. Hence, someone in product review may say, “The agent feels dumber.” Because it is. Pointing to the dashboard and saying, “But the evals are green” does nothing but demonstrate denial at scale.
Bad evals create false confidence, which is worse than no confidence. If your evals are too narrow, teams optimize to them. If your graders are brittle, they punish valid solutions and reward shallow compliance. If you rely entirely on LLM-as-judge without calibration against human review, you’ve moved the vibes one level down without removing them. If your eval set never changes, it becomes a living cemetery of old assumptions.
Notice what’s missing from a good eval: “Did the answer sound good?” Sounding good is the easiest thing modern models do. It’s what probabilistic systems designed to mimic truth, without actually knowing truth, do. It’s also the least useful quality signal you can collect. A confident agent that took the wrong tool path is dangerous.
One of the more interesting parts of the Anthropic postmortem is that the regressions came from sensible changes. Reducing latency is good, as is reducing verbosity (or it can be). Ditto better caching. Nobody sits in a product meeting and says, “Let’s make the coding agent worse.” They say, “Users hate waiting” or “We’re burning too many tokens,” and they’re right. But that right doesn’t justify the wrong of shipping a regression.
This is why AI teams need to stop treating quality, latency, and cost as a single blended metric. These are trade-offs, not synonyms. For example, a concise answer may be better for a status update but worse for a code review. Similarly, a lower-effort reasoning mode may be perfect for boilerplate but damaging for multi-file refactors. A cost optimization should have to prove it didn’t damage quality, and a prompt change should have to prove it didn’t damage behavior.
So what should we do?
If you’re a tech leader sitting at the intersection of “we have an agent in production” and “we’re not sure our evals are doing anything,” there’s hope and some clear guidelines of what to do next.
First, treat user complaints as your most valuable eval input. Every Slack message that says “Claude got dumber” or “the agent forgot what we just told it” is a test case waiting to be written. Anthropic’s mistake wasn’t a lack of eval infrastructure. It was the lag between user signal and eval coverage (two weeks). If your fastest path from production complaint to regression suite is measured in weeks, you have a process problem, not a tool problem.
Second, write fewer, better evals, and read every transcript. Anthropic’s recommendation of 20 to 50 tasks drawn from real failures is the right shape, because you don’t need a thousand synthetic test cases. You just need a few dozen pulled from production incidents, graded with a mix of code-based checks (for what you can deterministically verify) and LLM-as-judge calibrated against human review (for what you can’t deterministically verify).
Third, be sure to encode your product’s values in the eval. If you’re building a coding assistant, then you care about passing tests, preserving style, avoiding security mistakes, and not bulldozing through a repo. If you’re building a customer-support agent, by contrast, your concern shifts to factuality, tone, escalation, policy compliance, resolution rate, and whether the system created new problems while solving the old one. Generic “helpfulness” graders won’t capture any of that.
Fourth, make regression a release gate, instead of a release report. If a change drops a regression score, don’t ship the change. As I’ve argued before, the agents that survive in the enterprise are the ones that do a few things reliably and predictably, and the only way you get there is by refusing to deploy anything that breaks what already worked.
Finally, write the eval before the prompt. You need to be able to articulate what good looks like before you start tweaking the system. The prompt is the means to an end, and the eval captures that end in advance.
Moving beyond demo-ware
We’re still so early in our AI engineering journeys that perhaps we can be forgiven for mistaking vibes-driven demos for progress. However forgivable now, this won’t last. As Jones recently put it, “a lot of the problems people blame on AI are actually problems that always existed, AI just amplified them.” Evals are how you stop amplifying them.
The teams that win the next phase of AI engineering won’t be the ones with the most elaborate eval dashboards; they’ll be the ones with the most honest feedback loops. They’ll know which failures matter, and when a model upgrade helped and when it quietly broke a workflow. They’ll know, in short, when their agent is actually getting better.
Evals aren’t sexy, but they lead to sexy, production-ready systems.
Small language models: Rethinking enterprise AI architecture 4 May 2026, 2:00 am
Large language models (LLMs) are the workhorses of AI, supporting ever more sophisticated capabilities and workflows, and approaching near-human level performance.
But sometimes more isn’t always better — it’s just more. Specialized data and limited capabilities are just fine for some workflows.
This realization is driving the evolution of small language models (SLMs), rather than one-size-fits-all LLMs. SLMs — coming in the form of domain-specific models, statistical language models, and neural language models — are faster, cheaper, less resource-intensive, and more private than traditional LLMs, according to experts.
It’s not simply a replacement story, though. “The pattern is closer to a better division of labor,” says Thomas Randall, a research director at Info-Tech Research Group. “A routing architecture sends simple or well-scoped queries to a specialized small model, and complex queries to a large model.”
How are small language models made small?
While LLMs can feature parameter counts in the hundreds of billions — or, increasingly, trillions — SLMs typically fall in the 1 billion to 7 billion parameter range. Generally, anything below 10 billion is considered small.
Whereas LLMs are trained on petabytes of data, SLMs are trained on compact transformer architectures (neural networks) using smaller, specialized, high-quality datasets specific to their intended function. Several techniques help contain model size without compromising performance. These include the following:
- Knowledge distillation: A larger “teacher” model trains a small “student” model so that it can learn to mimic strong reasoning capabilities, but at a much smaller scale.
- Pruning: Redundant or irrelevant parameters are removed from neural network architectures.
- Quantization: Values are reduced from high-precision to lower-precision (that is, floating-point numbers are converted to integers) to reduce data size, speed up processing, and optimize energy consumption.
Larger models can also be modified and distilled into smaller, more specialized models through techniques like retrieval-augmented generation (RAG), when they are trained to pull from trusted sources before generating a response; fine-tuning and prompt tuning to guide responses to specific areas; or LoRa (low-rank adaptation), which adds lightweight pieces to an original model to reduce its size and scope, rather than retraining or modifying the entire model.
Ultimately with SLMs, enterprise data becomes a “key differentiator, necessitating data preparation, quality checks, versioning, and overall management to ensure relevant data is structured to meet fine-tuning requirements,” notes Sumit Agarwal, VP analyst at Gartner.
Benefits of small language models
The core driver of SLMs is economic, analysts note. “For high-volume, repetitive, scoped tasks (such as customer service triage), the costs of using a trillion-parameter generalist cannot be justified,” Info-Tech’s Randall points out.
Modest workflows for GPT-5 at scale, for instance, will generate unsustainable cloud bills. Using a limited, built-for-purpose SLM is “far better” and more efficient for modest workflows, Randall said.
The clearest business advantages emerge when three conditions align for a task, Randall notes: It is narrow in scope, repetitive and high volume, and latency tolerance is low. SLMs perform well when tasks do not require broad general knowledge or novel reasoning. They excel when a task requires a fast, consistent, repetitive application of a well-defined pattern.
The performance is often better in this area than with an LLM, as the SLM has been trained to do “one thing well rather than everything passably,” said Randall. “The SLM also avoids sifting through the noise of the entire internet in its generation of output, decreasing the chances of hallucination.”
Other benefits of SLMs:
- Low compute requirements: SLMs can run on-device (laptops, mobile phones), in edge cases, and even offline.
- Stronger privacy and security: Because they are small enough to run on-device or on-premises, SLMs minimize the risk of data leakage and cybersecurity events. This makes them desirable in highly regulated industries or in organizations handling sensitive data.
- Inference efficiency: Smaller models generate quick responses, which is ideal for real-time applications.
- Cheaper deployment: Hardware and cloud costs are lower.
- Customizability: Models are trained on a specific organization’s data.
Nvidia researchers also point to the adaptability, flexibility, and modular (Lego-like) system design of SLMs. Builders can add new skills and respond to evolving user needs, new formatting requirements, and changing rules and regulations in certain jurisdictions.
Further, SLMs support democratization, the researchers emphasize. When more users and enterprises are involved in building language models, AI can represent a more diverse range of perspectives and societal requirements. And, more people involved in creating and refining models can help the field advance more rapidly.
The Nvidia researchers go so far as to say that SLMs are “sufficiently powerful, inherently more suitable, and necessarily more economical for many invocations in agentic systems, and are therefore the future of agentic AI.”
IT analyst firm Gartner agrees to an extent, predicting that by 2027, enterprise use of small, task-specific AI models will be threefold more than their use of LLMs.
“The variety of tasks in business workflows and the need for greater accuracy are driving the shift towards specialized models fine-tuned on specific functions or domain data,” said Gartner’s Agarwal.
Use cases for small language models
SLMs shine for a variety of use cases including the following:
- Boilerplate tasks and simple command parsing and routing based on predefined templates.
- Content summarization and generation: SLMs can build detailed reports, user-tailored copy, web and social media messaging, and marketing materials.
- Chatbots and virtual assistants: Smaller models can provide real-time interaction, handle routine queries from both customers and internal users, and perform live transcription and translation.
- Content analysis: SLMs can perform data analysis and sentiment analysis to surface industry trends and help optimize strategy.
- Code generation: Small models can work alongside developers to help write and debug code.
- IoT, edge computing scenarios, and low-resource settings: SLMs can run locally on devices without the need for cloud hosting or internet connection.
- Specialized fields (financial, legal, medical) where data privacy is paramount and organizations must comply with changing regulations and laws.
Ultimately, SLMs are optimal for use cases requiring classification or document processing, Info-Tech’s Randall noted. For instance, a help desk might use an SLM to classify a ticket against 200-plus categories, a legal department might use one for contract clause identification, or a finance team might use one to read transaction logs and regulatory texts for fraud detection.
Limitations and trade-offs of small language models
As with anything, of course, SLMs introduce their own challenges.
The largest trade-off is breadth of knowledge and reasoning capabilities, said Randall. SLMs tend to degrade on tasks that require contextual awareness or multi-step reasoning across unfamiliar domains, or when a large context window is required. Smaller models may struggle with edge cases or tangential tasks (such as a help desk ticket requiring a new category) that a generalist LLM can handle.
Analysts call out other disadvantages including the following:
- Narrow scope: SLMs are trained in a specific domain and are constrained by their size and computational abilities. Generalization can be limited; models may struggle with tasks that are more nuanced, require deeper contextual understanding or multifaceted reasoning, or contain high levels of abstraction or intricate data patterns.
- Decreased robustness: SLMs can be prone to errors in areas outside their expertise, or when faced with more advanced adversarial inputs (such as multi-turn social engineering).
- Bias risks: If not carefully curated, smaller datasets could potentially amplify bias.
“General purpose LLMs retain advantages for open-ended reasoning and breadth of knowledge,” said Randall.
Therefore, enterprises should be pragmatic when implementing task-specific models. Gartner recommends piloting small, contextualized models in areas where LLMs have not met expectations around speed or response quality. They should also adopt “composite approaches” involving multiple models and workflow steps in use cases where single model orchestration has fallen short.
Further, enterprises must strengthen skills and data practices. “Prioritize data preparation efforts to collect, curate, and organize the data necessary for fine-tuning,” Gartner advises.
SLMs will not replace LLMs
Arguably, there will always be a case for both LLMs and SLMs, analysts note.
Randall anticipates continuing growth of SLMs in the enterprise as the volume of AI-mediated tasks expands, particularly for well-defined, highly repetitive tasks.
However, “the SLM versus LLM dichotomy is not a helpful one,” he stressed. “The more accurate picture will be organizations asking how to orchestrate multiple models of different sizes across different deployment contexts.”
Enterprise Spotlight: Transforming software development with AI 1 May 2026, 9:58 am
Artificial intelligence has had an immediate and profound impact on software development. Coding practices, coding tools, developer roles, and the software development process itself are all being reimagined as AI agents advance on every stage of the software development life cycle, from planning and design to testing, deployment, and maintenance.
Download the May 2026 issue of the Enterprise Spotlight from the editors of CIO, Computerworld, CSO, InfoWorld, and Network World and learn how to harness the power of AI-enabled development.
Running AI in the cloud is easy – and expensive 1 May 2026, 2:00 am
Let’s be honest about what’s happening in the market: Public cloud has become the easy button for AI. It offers immediate access to compute, storage, managed services, foundation model ecosystems, automation tools, and global reach. For enterprises that want to launch quickly, it is hard to argue against it. You do not need to spend years standing up infrastructure, hiring specialized operations teams, or engineering your own scalable environment before you can test your first use case.
This is exactly why adoption continues even as confidence in cloud resilience becomes more complicated. This article about the expanding cloud market makes the point clearly. Enterprises are not pulling back from hyperscale clouds despite numerous outages. They continue to move forward because the benefits of agility, scalability, and rapid deployment are too valuable to ignore. The cloud remains deeply embedded in business operations, and for many organizations, stepping away would undo years, often decades, of progress.
That is the essence of the easy button. The cloud removes the upfront burden of building and operating the heavy machinery yourself. It centralizes capability. It shortens the time to value. It gives executive teams a way to say yes to AI projects without first funding a long infrastructure transformation. For boards and CEOs under pressure to show AI progress now, that is an attractive proposition.
The economics are not as simple
What gets lost in the excitement is that convenience has a compounding cost structure. The same characteristics that make the public cloud attractive for AI also make it expensive to operate at scale. You pay not only for raw infrastructure but also for abstraction, acceleration, service layering, managed operations, premium tools, and the provider’s margin. As AI success grows, operating costs rise as well.
This matters because AI is not a single-application story. Enterprises rarely stop at a single model, pilot, or use case. They want dozens of solutions spanning customer service, software development, supply chain planning, security operations, analytics, and internal productivity. Every dollar committed to one expensive cloud-based AI workload is a dollar unavailable for the next. That is the strategic issue too many companies overlook.
The question isn’t whether cloud can run AI. Of course it can. In many cases, it is the fastest route to value. The more important question is whether long-term operational spending leaves enough room in the budget to build a portfolio of AI solutions rather than a few isolated wins. If the answer is no, the convenience premium starts to look less like acceleration and more like a constraint.
The operational trade-off
This issue is about something larger than outages. It’s about the economic behavior of hyperscalers and the operating assumptions enterprises are being trained to accept. Major providers are under constant pressure to control costs while expanding services. That means rushed releases, tighter operational budgets, more automation, and fewer deeply experienced engineers to provide oversight. Reliability shifts from an assumed baseline to something closer to good enough.
Azure is described as generating, testing, and deploying tens of thousands of lines of AI-generated code daily. That is not a trivial operating model. It reflects a platform in continuous expansion, becoming more opaque and harder to govern, even as enterprises place increasingly strategic workloads on top of it.
This should matter to AI buyers for two reasons. First, the “easy cloud” button becomes the “cloud dependency” button. You are not just consuming compute. You are tying your AI road map to a provider’s economic incentives, operational discipline, and willingness to prioritize resilience versus revenue expansion. Second, once the cloud becomes the default home for AI, enterprises are often forced to spend more on risk mitigation. Multiregion design, failover architecture, monitoring, governance, and vendor management all contribute to the real operating cost.
None of that means enterprises should abandon public cloud. Enterprises need to enter this partnership with their eyes open and understand that the easy button is rarely the cheap button.
Cloud providers will keep getting rich
The economic logic is straightforward. Providers know enterprises are unlikely to reverse course. Cloud is too embedded, too connected, and too central to ongoing modernization efforts. Outages create frustration, but usually not enough to trigger a mass exodus. The result is a market where providers can continue to expand AI services, attract more workloads, and increase revenue while customers absorb more of the operational burden.
That burden is not limited to compute and storage invoices. It includes the architecture required to withstand provider failures, the in-house talent needed to monitor complex environments, and the governance needed to control sprawl. Building with failure in mind is now a standard cost, not an avoidable exception. That is a profound shift, and enterprises should treat it as such.
The likely outcome is that cloud providers will continue to aggressively grow their AI revenue. Enterprises will continue to buy because the alternative is slower, harder, and often politically difficult within the organization. But that revenue growth will come at a cost to enterprise buyers, who may discover too late that an expensive AI operating model reduces the total number of AI bets they can afford to place.
The smarter path forward
Rather than adopt an anti-cloud strategy, enterprises need a selective cloud strategy. Use public cloud where speed, scale, and ecosystem access matter most. Be deliberate about which AI workloads deserve that premium and which might be better served over time by private cloud, hybrid architecture, or more controlled on-premises environments. Preserve optionality. Avoid treating the first convenient platform choice as a permanent architectural truth.
Always remember that AI success is not defined by how quickly you launch the first solution. It is defined by how many useful, sustainable, and economically rational solutions you can build over the next several years. Public clouds often look like (and could be) the right choice for AI workloads. However, enterprises that conflate ease with efficiency will fund cloud providers’ growth while limiting their ability to scale AI where it matters most. Look beyond the day when an AI workload goes live.
Are we ready to give AI agents the keys to the cloud? Cloudflare thinks so 30 Apr 2026, 6:54 pm
Cloudflare is giving AI agents full autonomy to spin up new apps.
Starting today, agents working on behalf of humans can create a Cloudflare account, begin a paid subscription, register a domain, and then receive an API token to let them immediately deploy code.
To kick things off, human users must first accept the cloud company’s terms of service. From there, though, their role in the loop is optional; they don’t have to return to the dashboard, copy and paste API tokens, or enter credit card details. The AI agent just does its thing behind the scenes and has everything it needs to deploy “in one shot,” according to Cloudflare.
While this could be a boon to developers and product builders, it also signals a larger, concerning trend of over-trust in autonomous tools, to the detriment of governance and security.
For example, noted David Shipley of Beauceron Security, cyber criminals are being forced to constantly set up new infrastructure as security firms and law enforcement fight back to block online attacks and scams. “Making it even faster to build new infrastructure and deploy it quickly is a huge win for them,” he said.
Giving agents the OAuth keys
Cloudflare co-designed the new protocol in partnership with Stripe, building upon the Cloudflare Code Mode MCP server and Agent Skills. Any platform with signed-in users can integrate it with “zero friction” for the user, Cloudflare product managers Sid Chatterjee and Brendan Irvine-Broque wrote in a blog post.
The new protocol is part of Stripe Projects (still in beta), which allows humans and their agents to provision multiple services, including AgentMail, Supabase, Hugging Face, Twilio, and a couple of dozen others, generate and store credentials, and manage usage and billing from their command line interface (CLI). An agent is given an initial $100 to spend per month, per provider.
Users need only install the Stripe CLI with the Stripe Projects plugin, login to Stripe, start a new project, prompt an agent to build something new, and deploy it to a new domain. If their Stripe login email is associated with a Cloudflare account, an OAuth flow will kick off; otherwise Cloudflare will automatically create an account for the user and their agent.
From there, the autonomous agent will build and deploy a site to a new Cloudflare account, then use the Stripe Projects CLI to register the domain. Once deployed, the app will run on the newly-registered domain.
Along the way, the agent will prompt for input and approval “when necessary,” for instance, when there’s no linked payment method. As Cloudflare notes, the agent goes from “literal zero” to full deployment.
To build momentum, the company is offering $100,000 in Cloudflare credits to startups that make use of the new capability via Stripe Atlas, which helps companies incorporate in Delaware, set up banking, and engage in fundraising.
How the agent takes action
Agents interact with Stripe and Cloudflare in three steps: discovery (the agent calls a command to query the catalog of available services); authorization (the platform validates identity and issues credentials); and payment (the platform provides a payment token that providers use to bill humans when their agents start subscriptions and make purchases).
Cloudflare emphasizes that this process builds on standards like OAuth, the OpenID Connect (OIDC) identity layer, and payment tokenization, but removes steps that would otherwise require human intervention.
During the discovery phase, agents call the Stripe Projects catalog command, then choose among available services based on human commands and preferences. However, “the user needs no prior knowledge of what services are offered by which providers, and does not need to provide any input,” Chatterjee and Irvine-Broque explained.
From there, Stripe acts as the identity provider, and credentials are securely stored and available for agents that need to make authenticated requests to Cloudflare. Stripe sets a default $100 monthly maximum that an agent can spend on any one provider. Humans can raise this limit and set up budget alerts as required.
The platform, said Cloudflare, acts as the orchestrator for signed-in users. Agents make one API call to provision a domain, storage bucket, and sandbox, then receive an authorization token.
The company argued that the new protocol standardizes what are typically “one off or bespoke” cross-product integrations. It uses OAuth, and extends further into payments and account creation in a way that “treats agents as a first-class concern.”
Concerns around security, operations
The trend of people buying products “wherever they are” will become ever more widespread, noted Shashi Bellamkonda, a principal research director at Info-Tech Research Group.
For instance, Uber has announced an Expedia integration for hotel bookings that will make it an ‘everything app.’ Other vendors are similarly expanding their partner ecosystems, because obtaining customers via other established platforms as well as their own is more cost-efficient, and “generally results in a higher lifetime value,” said Bellamkonda.
“This is Cloudflare turning every partner with signed-in users into a sales channel, and that is how you grow revenue in a developer market,” he said.
Beauceron’s Shipley agreed that Cloudflare is the “big winner” here. “Making it faster for anyone to buy your service and get using it is technology platform Nirvana.”
It’s “super cool, bleeding edge” and in theory, for legitimate developers becomes part of the even more automated build process, he said; “Vibe coders will rejoice.” But, he noted, so will cyber crooks.
Further, Bellamkonda pointed out, from an operational perspective, this could create added complexity for each vendor’s partner network when it comes to transaction execution and accountability. If issues related to provisioning or billing transactions arise, businesses must have a clearly defined process for resolving them with all parties.
“This will require considerable upfront thought on developing these comparatively new business models,” Bellamkonda said.
SAP npm package attack highlights risks in developer tools and CI/CD pipelines 30 Apr 2026, 3:03 am
A supply chain attack on SAP-related npm packages has put fresh scrutiny on the developer tools and build workflows that enterprises rely on to produce software.
The campaign, referred to as “mini Shai-Hulud,” affected packages used in SAP’s JavaScript and cloud application development ecosystem.
The malicious versions added installation-time code that could steal developer credentials, GitHub and npm tokens, GitHub Actions secrets, and cloud credentials from AWS, Azure, GCP, and Kubernetes environments.
Researchers at SafeDep, Aikido Security, Wiz, and several other security firms said the affected packages included mbt@1.2.48, @cap-js/db-service@2.10.1, @cap-js/postgres@2.2.2, and @cap-js/sqlite@2.2.2.
The suspicious versions were published on April 29 and were later replaced by safe releases.
The malware encrypted stolen data and sent it to public GitHub repositories created from victims’ own accounts, according to the researchers. It also used stolen GitHub and npm tokens to add malicious GitHub Actions workflows to accessible repositories and publish poisoned package versions.
SafeDep said the attackers abused a configuration gap in npm’s OIDC trusted publishing setup for the affected @cap-js packages. The compromise of mbt, meanwhile, is suspected to involve a static npm token.
The attackers also attempted to persist through Visual Studio Code and Claude Code configuration files. The technique puts developer workstations and AI-assisted coding tools closer to the center of supply chain security concerns.
Implications for CISOs
For CISOs, the case shows how quickly a tainted dependency can move beyond the build process. It also adds to concerns that developer environments, though central to enterprise software delivery, are still not governed with the same rigor as production systems.
“The fact that the malware was designed to harvest GitHub and npm tokens, GitHub Actions secrets, and cloud credentials from AWS, Azure, GCP, and Kubernetes in a single pass tells you that attackers now treat the developer workstation as a master key,” said Sakshi Grover, senior research manager for IDC Asia Pacific Cybersecurity Services.
A single compromised developer identity in a CI/CD pipeline can give attackers a route into the wider software supply chain, allowing them to push malicious code into packages that downstream developers may install with little visibility into tampering.
That lack of visibility remains a concern, Grover said, citing IDC’s Asia Pacific Security Survey 2025, which found that 46% of enterprises plan to deploy AI for third-party and supply chain risk analysis over the next 12 to 24 months. For now, she said, many organizations are still in the planning stage and have yet to operationalize AI-driven defenses against attacks such as the mini Shai-Hulud campaign.
Sunil Varkey, a cybersecurity analyst, described the campaign as a case of “living off the developer,” where attackers target developers, their tools, and automation rather than only the software package itself.
Varkey said the attackers went beyond poisoning npm packages by compromising maintainer GitHub accounts, abusing loosely configured npm OIDC Trusted Publishing, and using preinstall hooks to publish credential-stealing malware.
The more troubling element, he said, was the use of Visual Studio Code and Claude Code configuration files, specifically .vscode/tasks.json and .claude/settings.json, for persistence and propagation. That allowed the malware to execute when an infected repository was opened in Visual Studio Code, or when a Claude Code session started, he said.
“The attacker is turning the modern developer experience itself into an attack vector,” Varkey said.
The article originally appeared in CSO.
Harness teams of coding agents with Squad 30 Apr 2026, 2:00 am
At Kubecon Europe recently, Linux kernel maintainer Greg Kroah-Hartman said something that surprised me. After more than a year of AI-based pull requests and security reports that were worthless, living up to their nickname of “slop,” suddenly in the last month or so Kroah-Hartman discovered that those reports had become useful. At the time he didn’t know why, but guessed it was the result of improved tools and a deeper understanding of how to use them.
Since then, of course, we’ve learned about Anthropic’s Claude Mythos and seen the resulting scramble across closed-source and open-source projects to patch the significant bugs and issues Mythos has unveiled. The fixes and updates needed by large projects can be managed by their equally large teams, with corporate input as well as volunteers from around the world. But how do smaller projects deal with the rise in reported critical vulnerabilities, when they’re usually run by one or two people, often working in their spare time?
It’s a crisis of developer productivity. We need code that’s fixed and we need it now, but we don’t have enough skilled developers to deliver those fixes in the limited time available.
Can agents solve the problem?
Agent harnesses have become increasingly powerful tools, providing frameworks for orchestrating and managing teams of agents. General purpose tools like OpenClaw have proven to be particularly popular, though they can be expensive to run, with operations using up a substantial number of tokens across models and services. However, like most general purpose AI applications based on large language models (LLMs), inaccuracies and hallucinations can affect outputs.
Even so, an approach like this that’s grounded both in a defined methodology and in a significant corpus of data could help us meet the sudden demand for increased developer productivity — using the structured nature of code and APIs as grounding and the combinations of skills that go into building a modern software development team and addressing the various aspects of the software development life cycle.
What’s needed is a way to take advantage of those tools to build on techniques like spec-driven development and agent harnesses to provide developers with their own team of agents. Soon, agents may provide that force multiplier needed to keep ahead of AI red teams and at the same time help clear out large amount of technical debt.
Here comes the Squad
One interesting example of this approach is Squad, an open-source project from Brady Gaster, Principal PM Architect in the CoreAI Apps and Agents team at Microsoft. Squad builds an agent harness around GitHub Copilot, orchestrating a team of agents to work on your code with you. Designed to be installed with a single CLI call, Squad creates agents to handle application development: a developer lead, a front-end developer, a back-end developer, and a test engineer. Other roles, like documentation, can also be managed by Squad.
The intent is to replicate the structure of a team building a web application, using natural language inputs to define the task, with the agent harness then coordinating Squad’s agents to build and test the necessary code. Gaster has made some interesting decisions as part of the tool’s architecture, such as requiring a separate agent to fix issues detected by another agent’s tests.
This approach is designed to prevent an agent from looping around the same set of statistically generated outputs. Instead, a new agent offers a new context window and a new set of seeds, allowing it to generate different solutions to the same inputs. Only then will Squad generate a pull request for human review. You the developer are still in the loop, but you’re the senior developer and architect to Squad’s team of junior engineers.
Another interesting architectural decision was to ignore the convention of having agent-to-agent chats as a tool for synchronizing decisions. Experience inside Microsoft has shown this approach to be fragile. As a result, Squad treats agents as a set of asynchronous distributed computing tasks, using external persistent storage to hold details of architectural and other decisions. The shared storage, based on a strict format that can be accessed by different generations of the Squad agents, ensures that decisions can be passed between projects and that context is preserved between sessions.
Having a defined source of context also ensures that when any member of your team clones your application repository, their Squad agents have access to the same “memory” and can start working as soon as the Squad CLI is loaded or launched from Visual Studio Code or GitHub Copilot. It’s an efficient approach that saves time and ensures that everyone on the project and using Squad has the same starting point.
Getting started with Squad
To get started with Squad, you need to have an up-to-date Node.js installation on your development machine, along with a Git repository to store code and the Markdown documents used by Squad to store its context. With those in place, a single call to npm installs the Squad CLI, ready for use.
You set up the Squad environment with its init command. You can run Squad from its CLI or from inside Visual Studio Code and GitHub Copilot, where it’s available as an agent. You can also use Squad from the GitHub Copilot CLI, which gives you an interactive view of how the various Squad agents work.
Squad’s CLI works well for basic projects but using Squad as part of Copilot also gives access to additional resources, including Model Context Protocol (MCP) servers, which can help with more complex application developments as well as providing more useful grounding for specific Squad agents. However, there’s enough flexibility here to fit Squad into your existing toolchain, allowing you to make it part of your workflow, rather than vice versa.
There is a third way to use Squad: working with the Squad SDK to build your own automation framework around the Squad tooling. Here you’ll use TypeScript to manage agent creation, as well as writing your own routers and coordination services. The Squad SDK is a powerful tool that can be used as part of more formal development processes, for example integrating into a CI/CD pipeline to help triage a high volume of pull requests. As all three ways of working with Squad use the same back end, they all share the same memories, so will respond to inputs in similar ways.
Using Squad to write and fix code
I used Squad from the Copilot CLI, building a basic Node Express application, with a web front end. What was perhaps most interesting about the process was that the Squad harness allowed its role-based agents to work in parallel: an agent building back-end code to support service APIs could run at the same time as an agent that was building a React-based user interface. The initial squad of agents that Squad generated included an architect as well as front-end and back-end developers.
Squad’s output was, at least in my test applications, clear and easy to understand, ready to be used as the basis for a more complex application. It was delivered quickly, using a test-driven approach to ensure that code performed as intended, with no obvious bugs. By taking a formal approach to software development, Squad can reduce risks and explain its actions to a human user. It can also be used to document the code it delivers, using another specialized agent to deliver documentation.
There’s plenty of human supervision in the process, though there’s also the option of handing over control of repetitive tasks to Squad. After some time, you can build up enough trust that you don’t need to approve every new file or directory. A squad works in the context of your Git repository, but if you want more security you can choose to run your squad inside a dev container, keeping it in an isolated environment.
Here comes the artificial junior developer
We’re still at the very beginning of the process of using AI-based tooling as part of our development workflows, but the available tools are starting to mature very quickly — both as models improve and as we learn how to build the long workflows needed to implement agent-based applications.
Squad’s approach to development mixes well-understood software development methodologies with the team structure necessary to deliver applications. For now, as Squad is alpha code, it’s something to experiment with in limited, well-understood use cases.
But as our understanding of how to use AI-powered development tools grows, it’s easy to see how AI coding might evolve to become something like Squad — a way of harnessing agents to behave like a pocket development team that keeps a human in the loop as development lead to a team of artificial junior developers. And maybe we’ll be able to keep up with Claude Mythos and its descendants.
Making AI work for databases 30 Apr 2026, 2:00 am
In The Sorcerer’s Apprentice, Mickey Mouse uses a magic spell to do his chores. The spell animates a broom that is tasked with carrying water from the well. While the animated broom is managed, it gets the job done; when Mickey falls asleep, the broom carries on its work. When Mickey can’t stop the broom, he chops it to bits with an axe, but all the pieces re-animate and carry on as before. Finally the Sorcerer intervenes to stop the broom and clean up the mess.
Similarly, AI promises to lighten the burden of operating databases. For example, using AI to write SQL queries or optimize performance are obvious areas to apply this technology. There is a huge amount of SQL on the internet that can be used to train models around what good queries should look like, and transforming natural language into accurate SQL has a lot of promise.
Further, using AI to handle database management issues should deliver faster performance, more reliable systems, and more efficient use of resources. Customers demand more help around those pain points, and they expect that any supplier can respond to those issues faster with AI. For problems that companies view as “low hanging fruit,” they expect self-service AI to solve those problems on demand rather than waiting.
AI promise meets real-world challenge
Already, we have seen AI get deployed around SQL and database management. BIRD (BIg bench for laRge-scale Database grounded text-to-SQL evaluation) publishes its benchmark around how models perform, with the current top AI performing at nearly 82% execution accuracy, based on a Valid Efficiency Score (VES). (See the paper on BIRD for details.) How good is a VES of 82%? Currently, human database engineers have a VES of nearly 93%.
The current gap between human and AI performance will shrink over time. But it is currently a great example of the Pareto Principle at work — from around 20% of your effort, you can get 80% of your results. To achieve that remaining 20% of results, you have to put in 80% of your effort. With AI, dealing with the simpler issues is where you can achieve the best results, but the harder problems still need a human in the loop to solve the problem or reach the intended goal.
For database management, this is something that we have seen at Percona. Using previous consulting engagements and service delivery projects as a base, we looked at how to automate steps around database management so customers could use AI to solve problems. Once we had the model developed, we tested it internally on database installations. We found that AI did help our team to deliver more efficiently around those simple problems, speeding up how fast they could respond.
At the same time, while these AI systems could make progress on more complex requests, they could not complete the “last mile” by themselves at the start. To overcome this, we looked at how the AI models used data to formulate responses and what sources the model called on most often. This led to more refinement and improvement in the systems alongside a human decision-maker that could understand what the AI was recommending, why it would be suitable, and where it could be improved.
Databases are essential components in the technology stack. As systems of record and sources for data analysis, they have to be reliable, available, and secure. Any decision around databases — from which database you choose for the job through to choices on management or optimization — can have a big impact. Any change has to be managed, or the result can be a broken application.
AI and the future of databases
Database management needs AI. The demand from customers for faster fixes and better performance is not going away, and those customers expect their suppliers to use AI in the same way they might use AI internally. For companies involved in service and support around IT including databases, applying AI to solve problems faster isn’t something that you can avoid. However, the human in the loop model will be essential for these service and support requirements for the foreseeable future. With databases so critical to how applications function and support the business, fully automating service with AI is not yet reliable for 100% of requests. As AI improves, the speed will benefit the majority of potential issues. However, the more complex problems will still require human expertise and control.
The demands of database customers will force teams to use AI. Whether this is internal teams that adopt AI to help them manage database deployment within internal developer platforms, or external service providers that support customers around problems. Customers will move to alternatives if they can’t get the speed of response that they expect. This could be through adopting another service provider for a database like PostgreSQL, or moving to a cloud or managed service provider that can offer better response times.
Mickey used magic to try and solve a problem, but he did not foresee all of the potential consequences. For those who are not database specialists, AI can help them write SQL, manage common tasks, or solve some of the simple problems, but there will always be edge cases where human skills and understanding will be needed. Arthur C. Clarke’s Third Law states that any sufficiently advanced technology is indistinguishable from magic, but the combination of AI and human skill around databases will have the greatest long-term impact without resorting to sorcery.
—
New Tech Forum provides a venue for technology leaders—including vendors and other outside contributors—to explore and discuss emerging enterprise technology in unprecedented depth and breadth. The selection is subjective, based on our pick of the technologies we believe to be important and of greatest interest to InfoWorld readers. InfoWorld does not accept marketing collateral for publication and reserves the right to edit all contributed content. Send all inquiries to doug_dineley@foundryco.com.
Critical GitHub RCE bug exposed millions of repositories 29 Apr 2026, 4:54 am
A critical remote code execution (RCE) vulnerability in GitHub could potentially allow attackers to execute arbitrary code on GitHub.com and GitHub Enterprise Server.
Uncovered by Wiz researchers, the now-patched bug exploited how GitHub handles server-side “git push” operations. By crafting malicious input within a standard Git push, an authenticated user could execute arbitrary commands via GitHub’s backend Git processing pipeline.
GitHub acknowledged the severity of the finding, with CISO Alexis Wales noting, “A finding of this caliber and severity is rare, earning one of the highest rewards available in our Bug Bounty program.”
GitHub fixed the issue on GitHub.com and released patches for all supported versions of GitHub Enterprise Server within hours of the report. However, Wiz said that 88% of Enterprise Server instances remained vulnerable on the internet at the time of public disclosure.
GitHub’s faulty processing of git push
The flaw, tracked as CVE-2026-3854, stemmed from how GitHub processes git push requests within its backend Git infrastructure. According to Wiz, the issue involves an internal component referred to as X-STAT, which sits in the path of GitHub’s server-side handling of Git operations.
Wiz researchers found that a specially crafted git push could pass maliciously structured input into X-STAT, where it was not safely handled before being incorporated into backend command execution. Because this processing happens server-side as part of GitHub’s normal handling of repository events, the input could influence how commands were constructed or executed within that pipeline.
The flaw received a near-critical CVSS rating of 8.8 out of 10, and was fixed in GitHub Enterprise Server versions 3.14.25 through 3.20.0. The flaw was categorized by GitHub as a “command injection” issue, resulting from “improper neutralization of special elements used in a command.”
AI was reportedly used in finding this flaw, using the IDA MCP (AI-augmented) reverse engineering tooling. “This is one of the first critical vulnerabilities discovered in closed-source binaries using AI, highlighting a shift in how these flaws are identified,” Wiz researcher Sagi Tzadik said in a blog post. “Despite the complexity of the underlying system, the vulnerability is remarkably easy to exploit.”
Full compromise across tenants
In its analysis, Wiz detailed how the issue could be escalated from initial command execution to full remote code execution on affected systems.
“On GitHub.com, this vulnerability allowed remote code execution on shared storage nodes. We confirmed that millions of public and private repositories belonging to other users and organizations were accessible on the affected nodes,” Tzadik said, adding that the impact was even more severe for self-hosted environments. On GitHub Enterprise Server, the vulnerability granted full server compromise, including access to all hosted repositories and internal secrets.
The article originally appeared in CSO.
Oracle NetSuite announces AI coding skills for SuiteCloud developers 29 Apr 2026, 3:16 am
Oracle NetSuite is adding AI capabilities to SuiteCloud to help developers customize its ERP platform faster using natural language prompts.
In a statement, the company said its NetSuite SuiteCloud Agent Skills “will make it easier for developers to create customized vertical and industry-specific applications by giving AI coding assistants a better understanding of the conventions, patterns, and best practices in SuiteCloud – NetSuite’s standards-based AI extensibility and customization platform.”
The new skills give AI coding assistants NetSuite-specific development guidance, including UI framework references, permission codes, SuiteScript fields, documentation practices, OWASP security guidance, and tools to help migrate older SuiteScript 1.0 code to SuiteScript 2.1.
This comes as developers increasingly use AI coding assistants in their daily work. Stack Overflow’s 2025 Developer Survey found that 84% of respondents were either using or planning to use AI tools in their development process, up from 76% a year earlier.
The tougher challenge for enterprise software vendors is making those tools understand how business applications actually work. For platforms like NetSuite, useful AI assistance requires knowledge of the platform’s own APIs, permission models, UI conventions, and business workflows. In ERP systems, even a small customization error can ripple into core business operations.
Impact and adoption challenges
NetSuite said it is “introducing SuiteCloud development guidance across more than 25 AI coding platforms.” Analysts said this could reduce friction for developers by making NetSuite-specific knowledge available across widely used AI coding tools, rather than limiting it to a single vendor-controlled environment.
“If you can package platform-specific knowledge in a format that drops into any of the major AI coding tools through an open framework, removing a lot of friction, that is great for enterprise developers,” said Neil Shah, VP for research at Counterpoint Research.
However, broader adoption across enterprise software platforms may depend on how ready vendors and customers are to switch from their long-established development practices.
“Enterprises have already invested in systems and personnel to build their applications using their own proprietary approaches,” Shah said. “We will have to see how soon vendors adopt this new approach and whether they are ready to let go of sunk costs and perhaps some personnel.”
In this sense, the technology may be more immediately useful for new applications or for modernization work around legacy systems, rather than for wholesale redevelopment of existing enterprise applications. Cost and governance are other important considerations.
“What the token economics will be as enterprises get up the learning curve remains to be seen, as the initial token burn rate is likely to be significantly higher,” Shah said. “Also, security and risk are big challenges here, as ERP apps are tightly coupled, and one small change in approach that does not work well with the proprietary stack could break downstream workflows and become a disaster.”
That means companies are likely to test such tools cautiously, especially for customizations that touch sensitive data. Shah said that enterprises will have to use this in a sandboxed environment to check for code hallucinations and to see what breaks in terms of business logic, security, or privacy.
Page processed in 0.184 seconds.
Powered by SimplePie 1.3, Build 20180209064251. Run the SimplePie Compatibility Test. SimplePie is © 2004–2026, Ryan Parman and Geoffrey Sneddon, and licensed under the BSD License.